

For a customized experience,
pick an option below to see iControl in action!
Choose a relevant industry to
see iControl in action:

Banking, Financial Services
and Insurance Industry
Please click on the Next button or the highlighted portion on
the screen to navigate through the demo.
This is a sandbox demo experience with a preordained user
journey to showcase product capabilities at a high level.
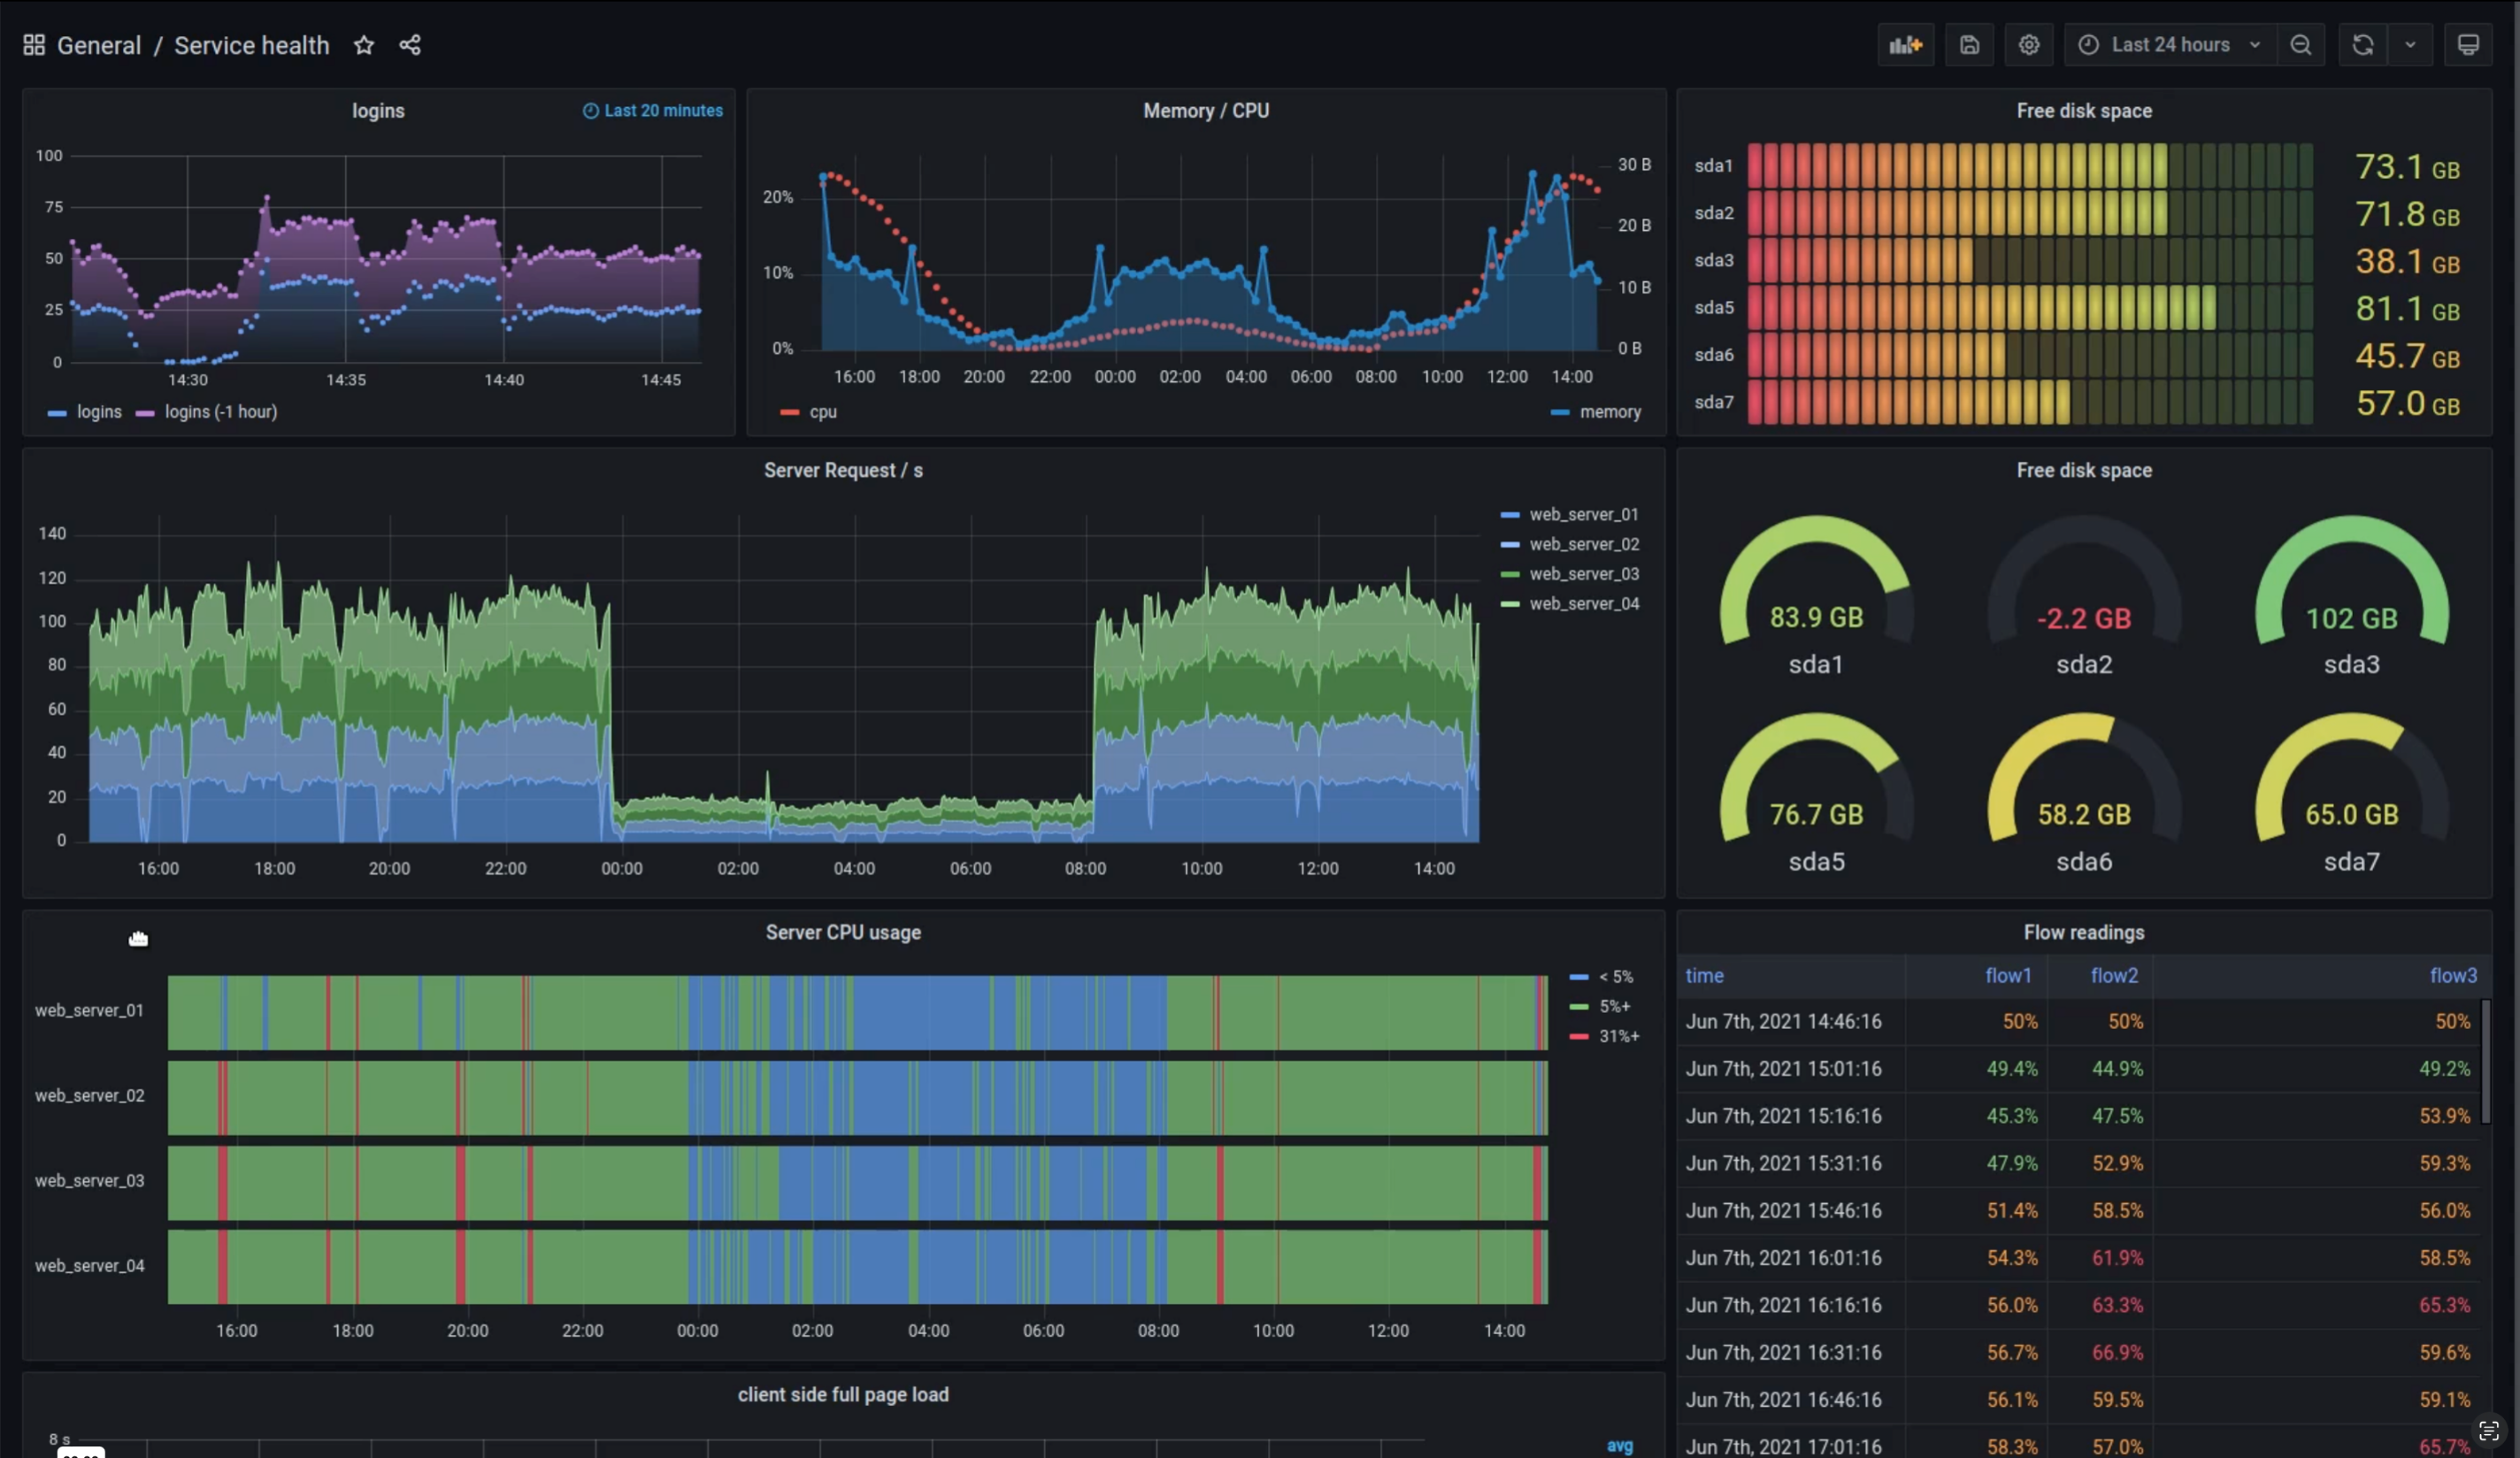
iControl Home Screen provides a bird’s eye view of your organization.

Undecided: The targets that are not active at the current timestamp.

Breached: The targets that are breached.

Warning: The targets that iControl predicts are going to breach based on historical analysis.

Not breached: The targets that are not-breached and are in a healthy state.

Completed: The targets for which monitoring is completed today.
.png)
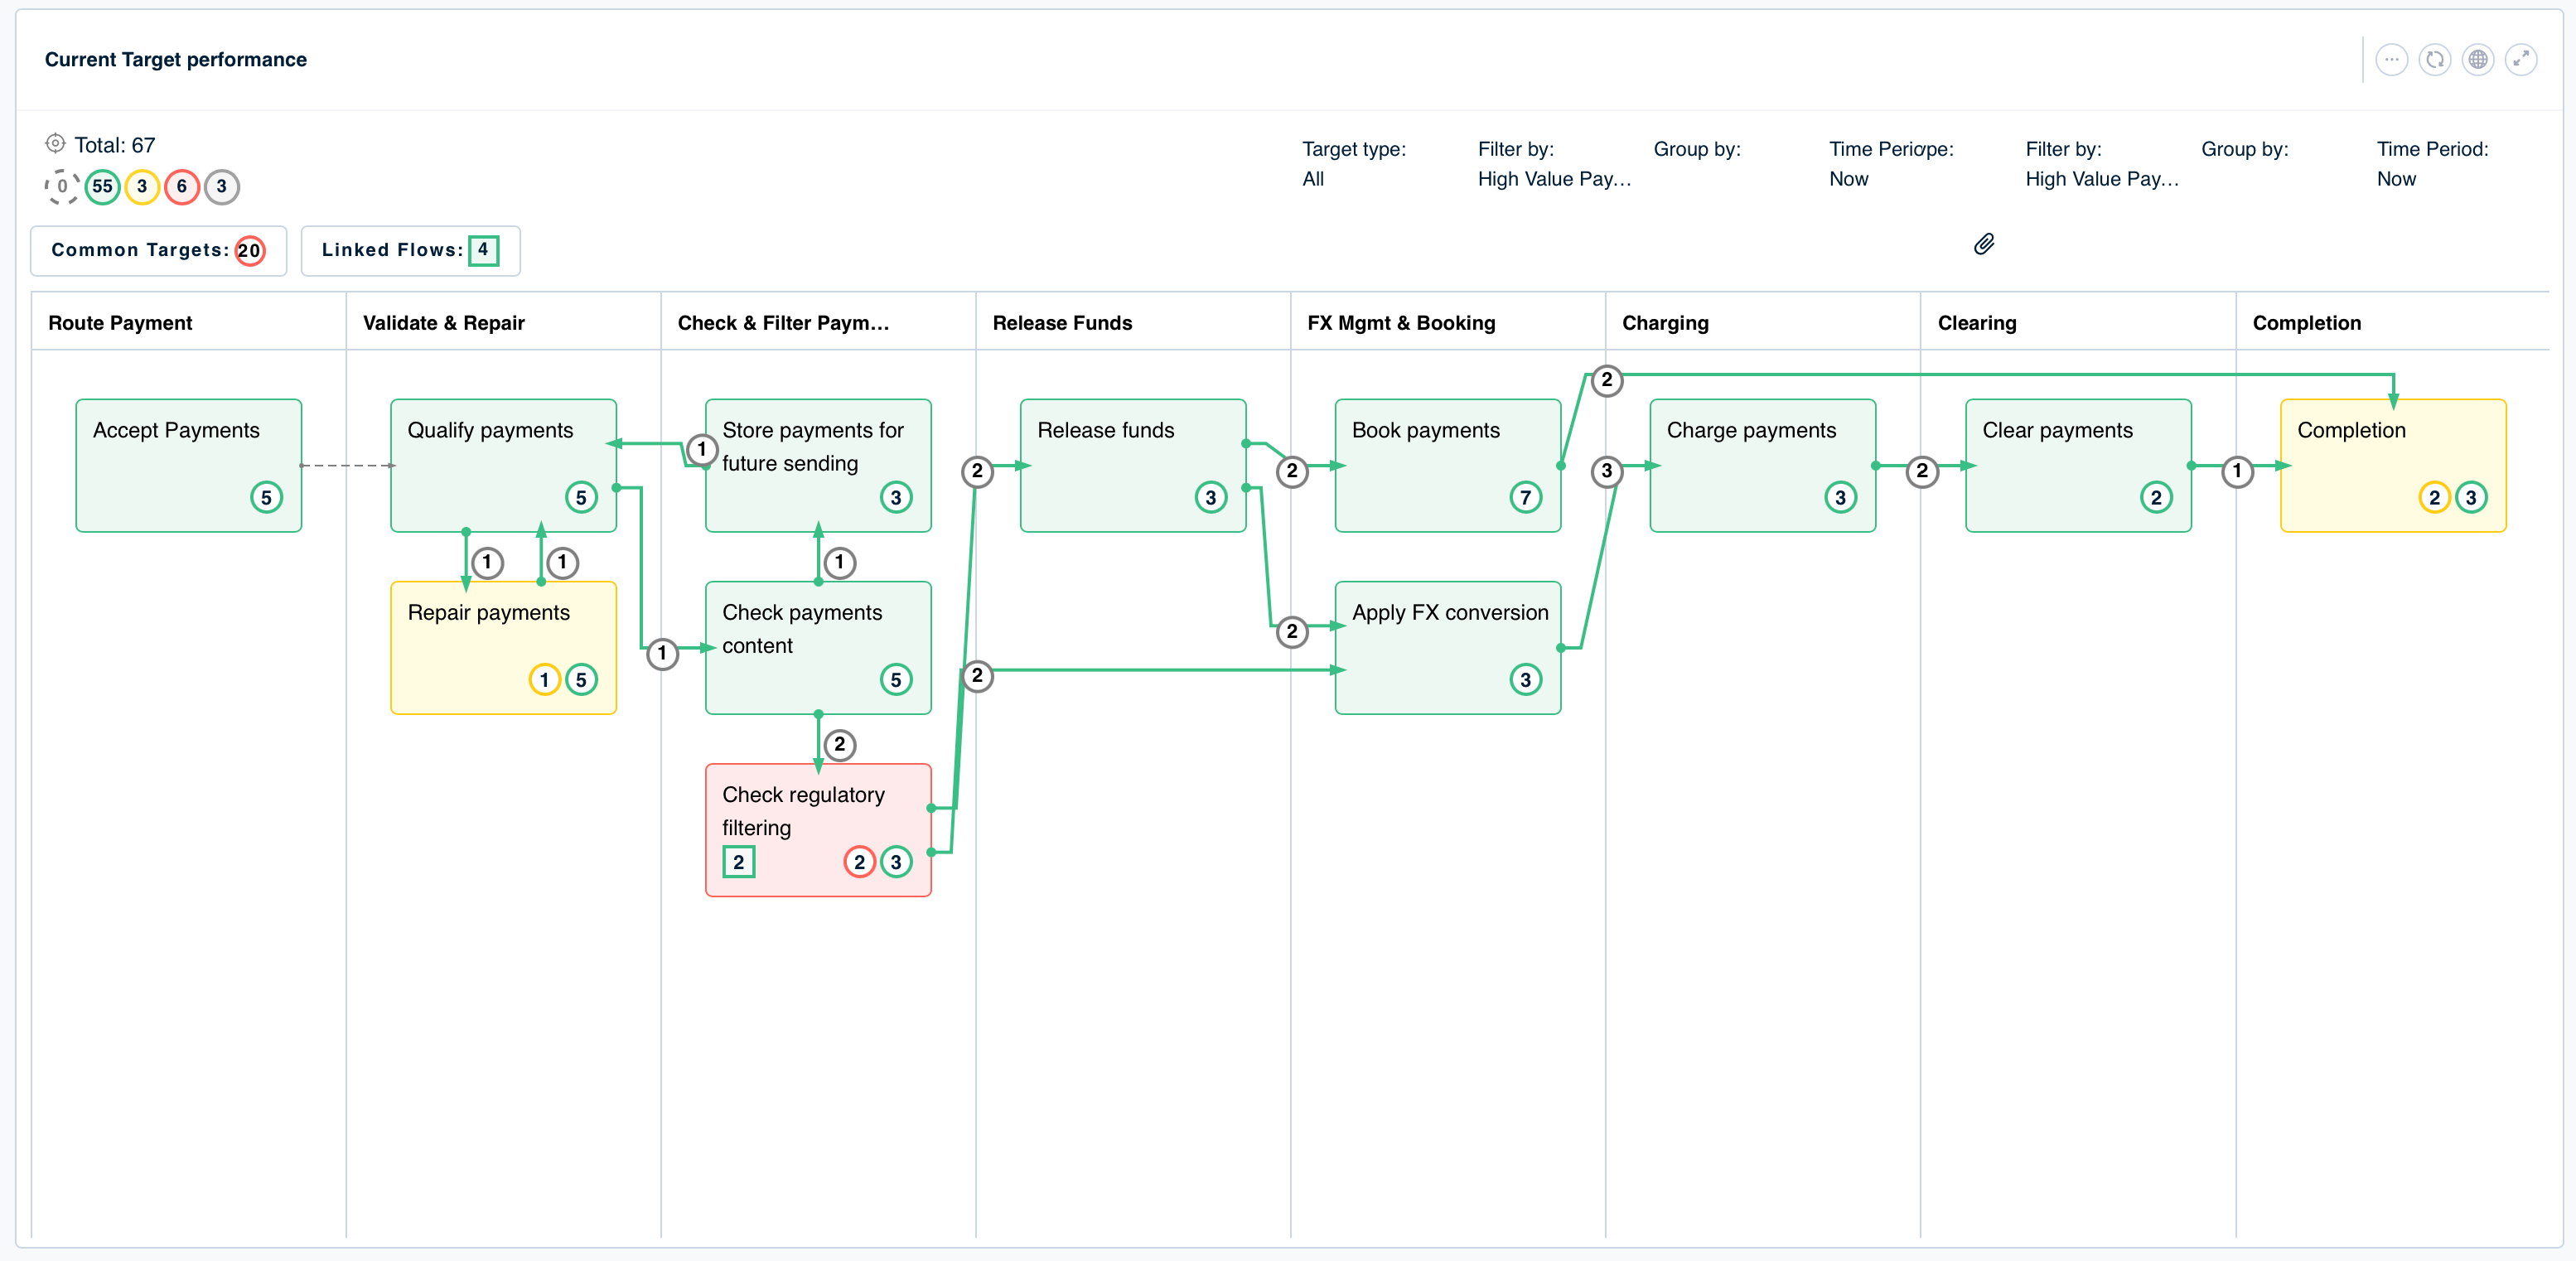
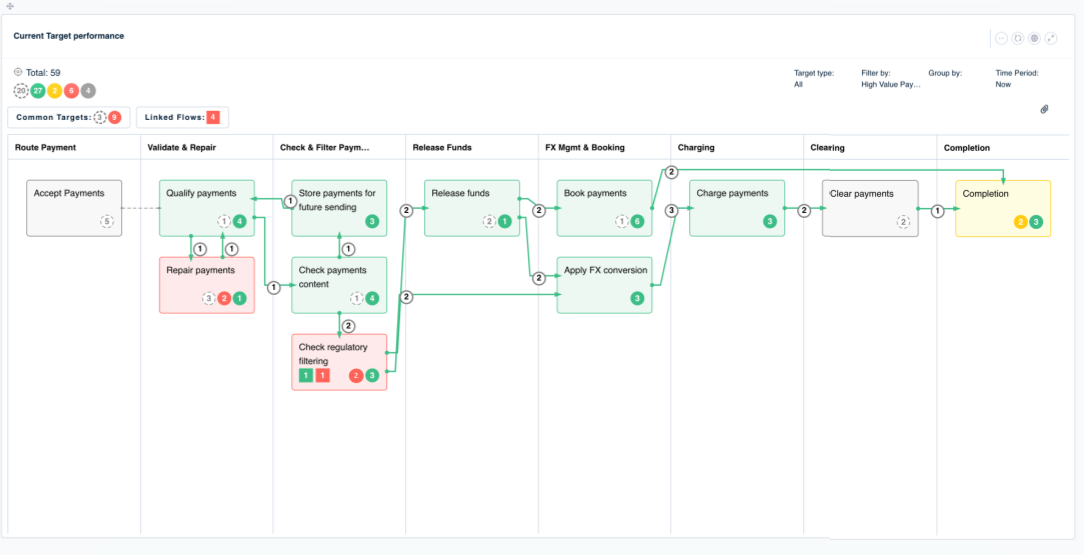
Common Targets: These are the targets which are applicable to the entire flow and not restricted to a particular step.
.png)
Linked Flows: These are the Parent/Child flows of the selected flow. Any impact on the child flow affects the health of the parent flow.
Click here to check what linked parent/child dependencies are impacting the business flow.
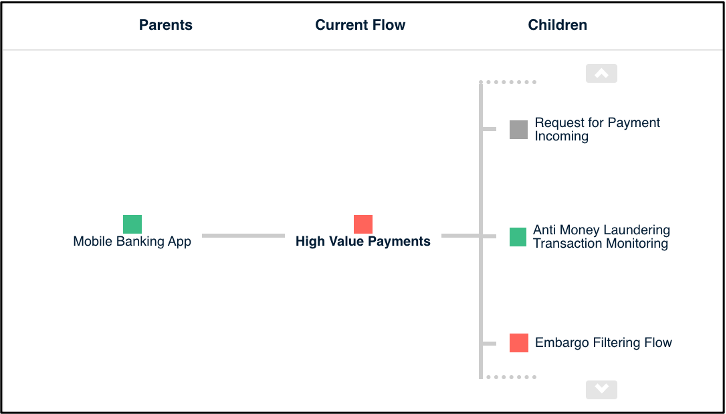
Dependencies impacting a business flow through the Parent-Child flow associations.
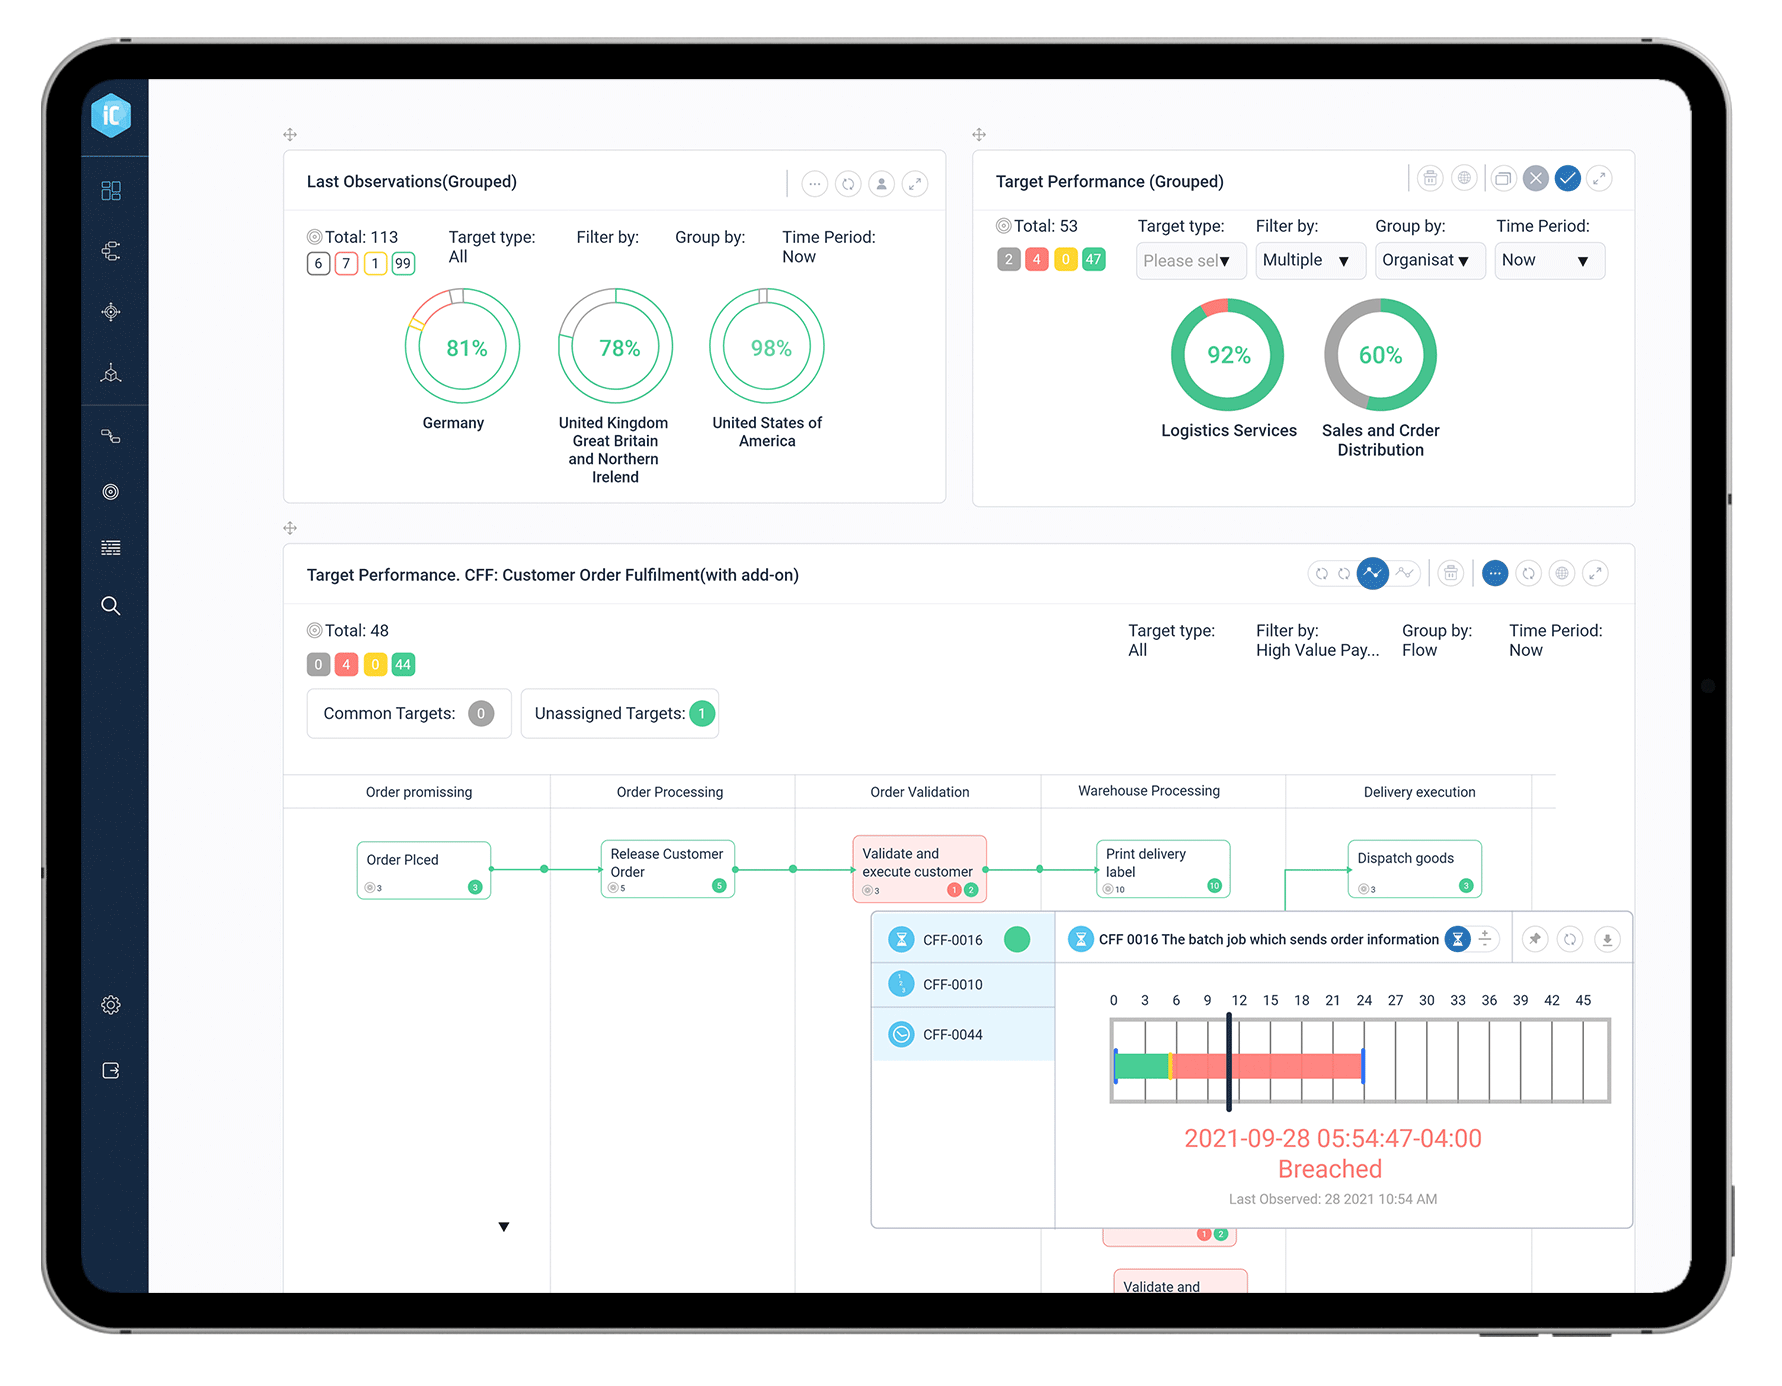
Widget 1 – Process View helps users to locate issues and take proactive action.

Click here to check the breach status.
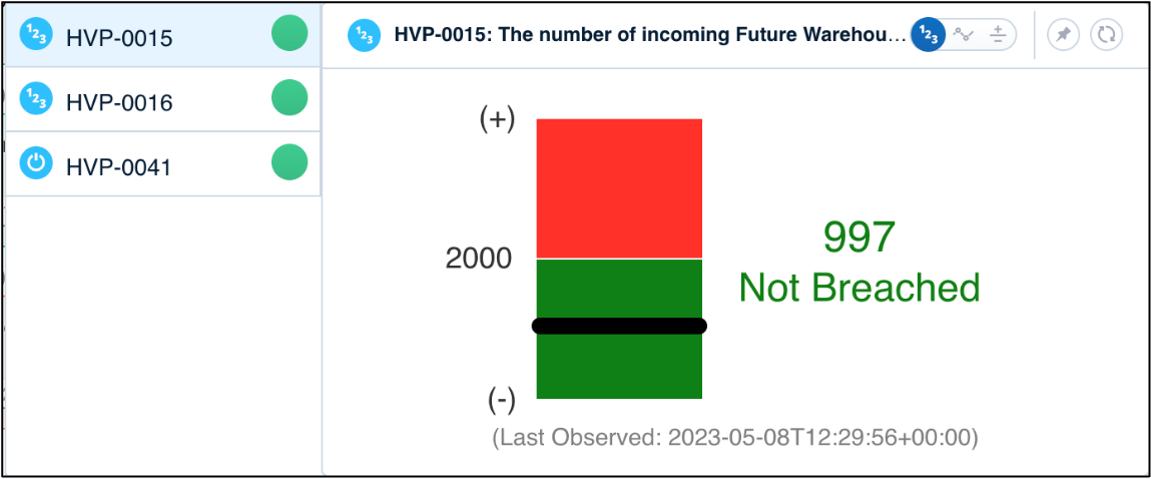
Breach status based on the type of business control.

Click here.
Check early warnings powered by machine learning predictions.
Check here.
.png)
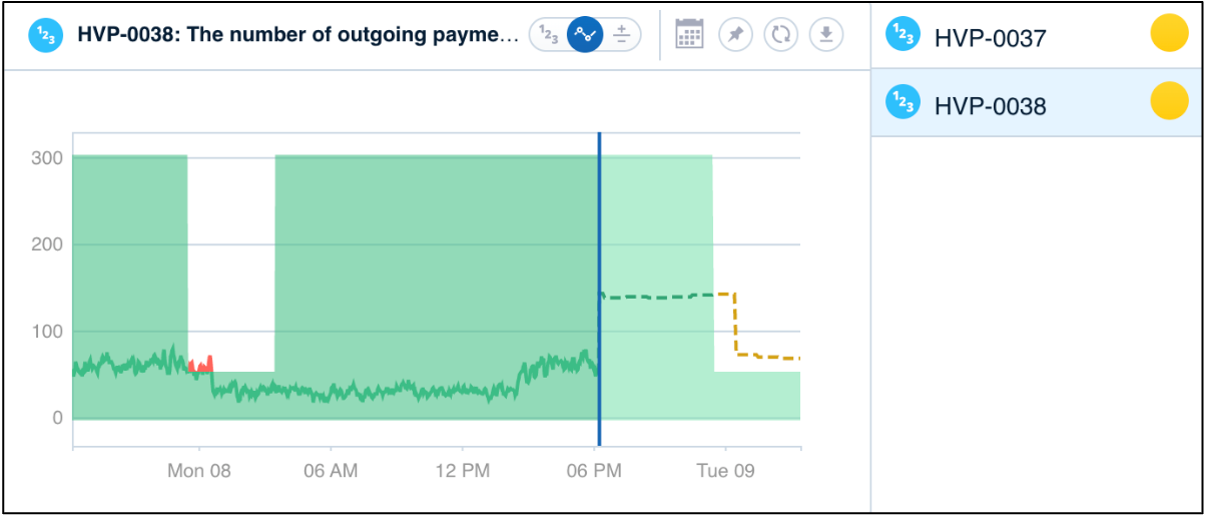
Click here to view the details of underlying breached targets.
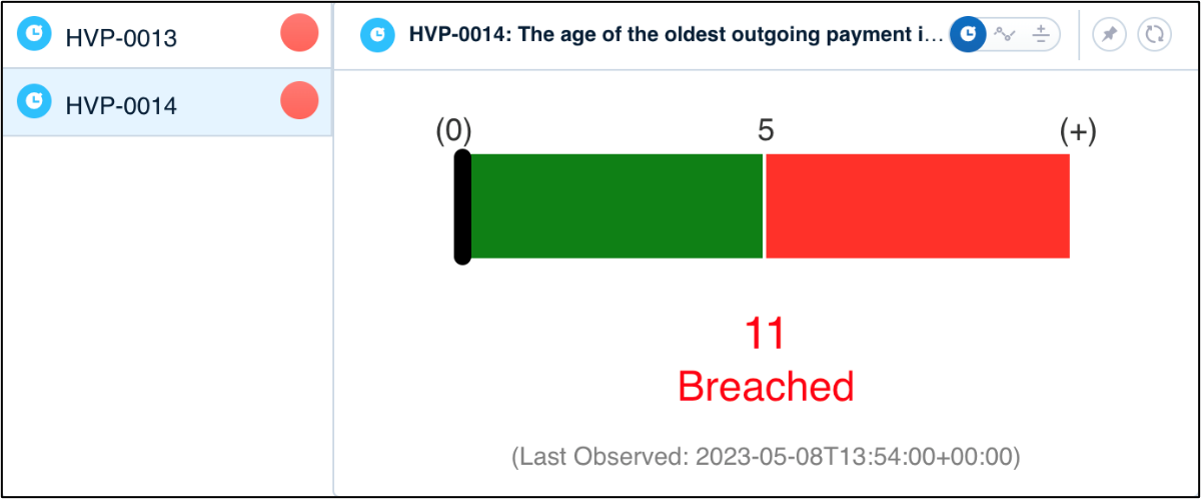
Click here to toggle to the trendline view.
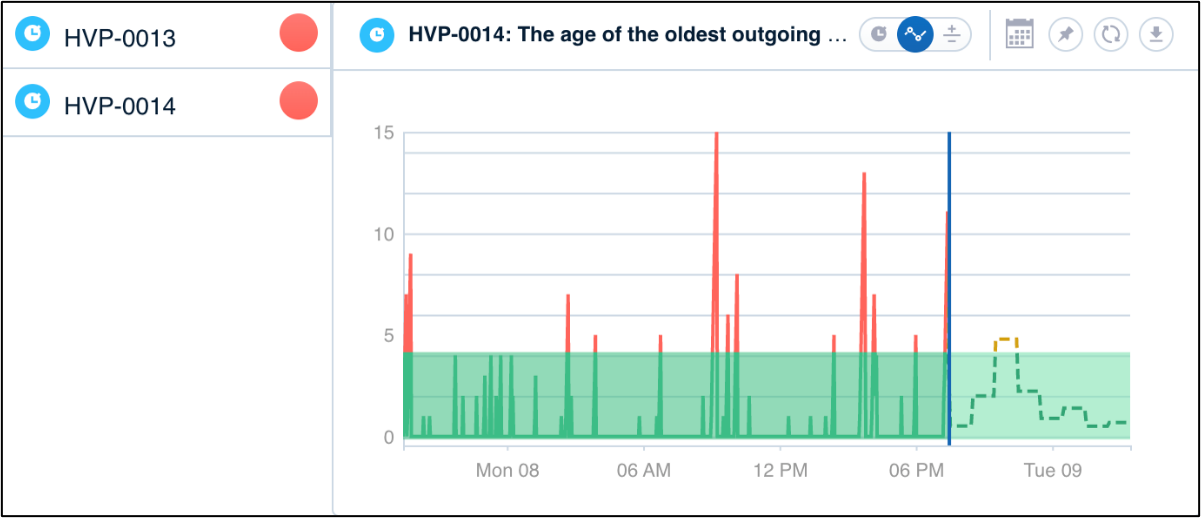
Click here to drill down into the underlying breach data on the targets.
.png)
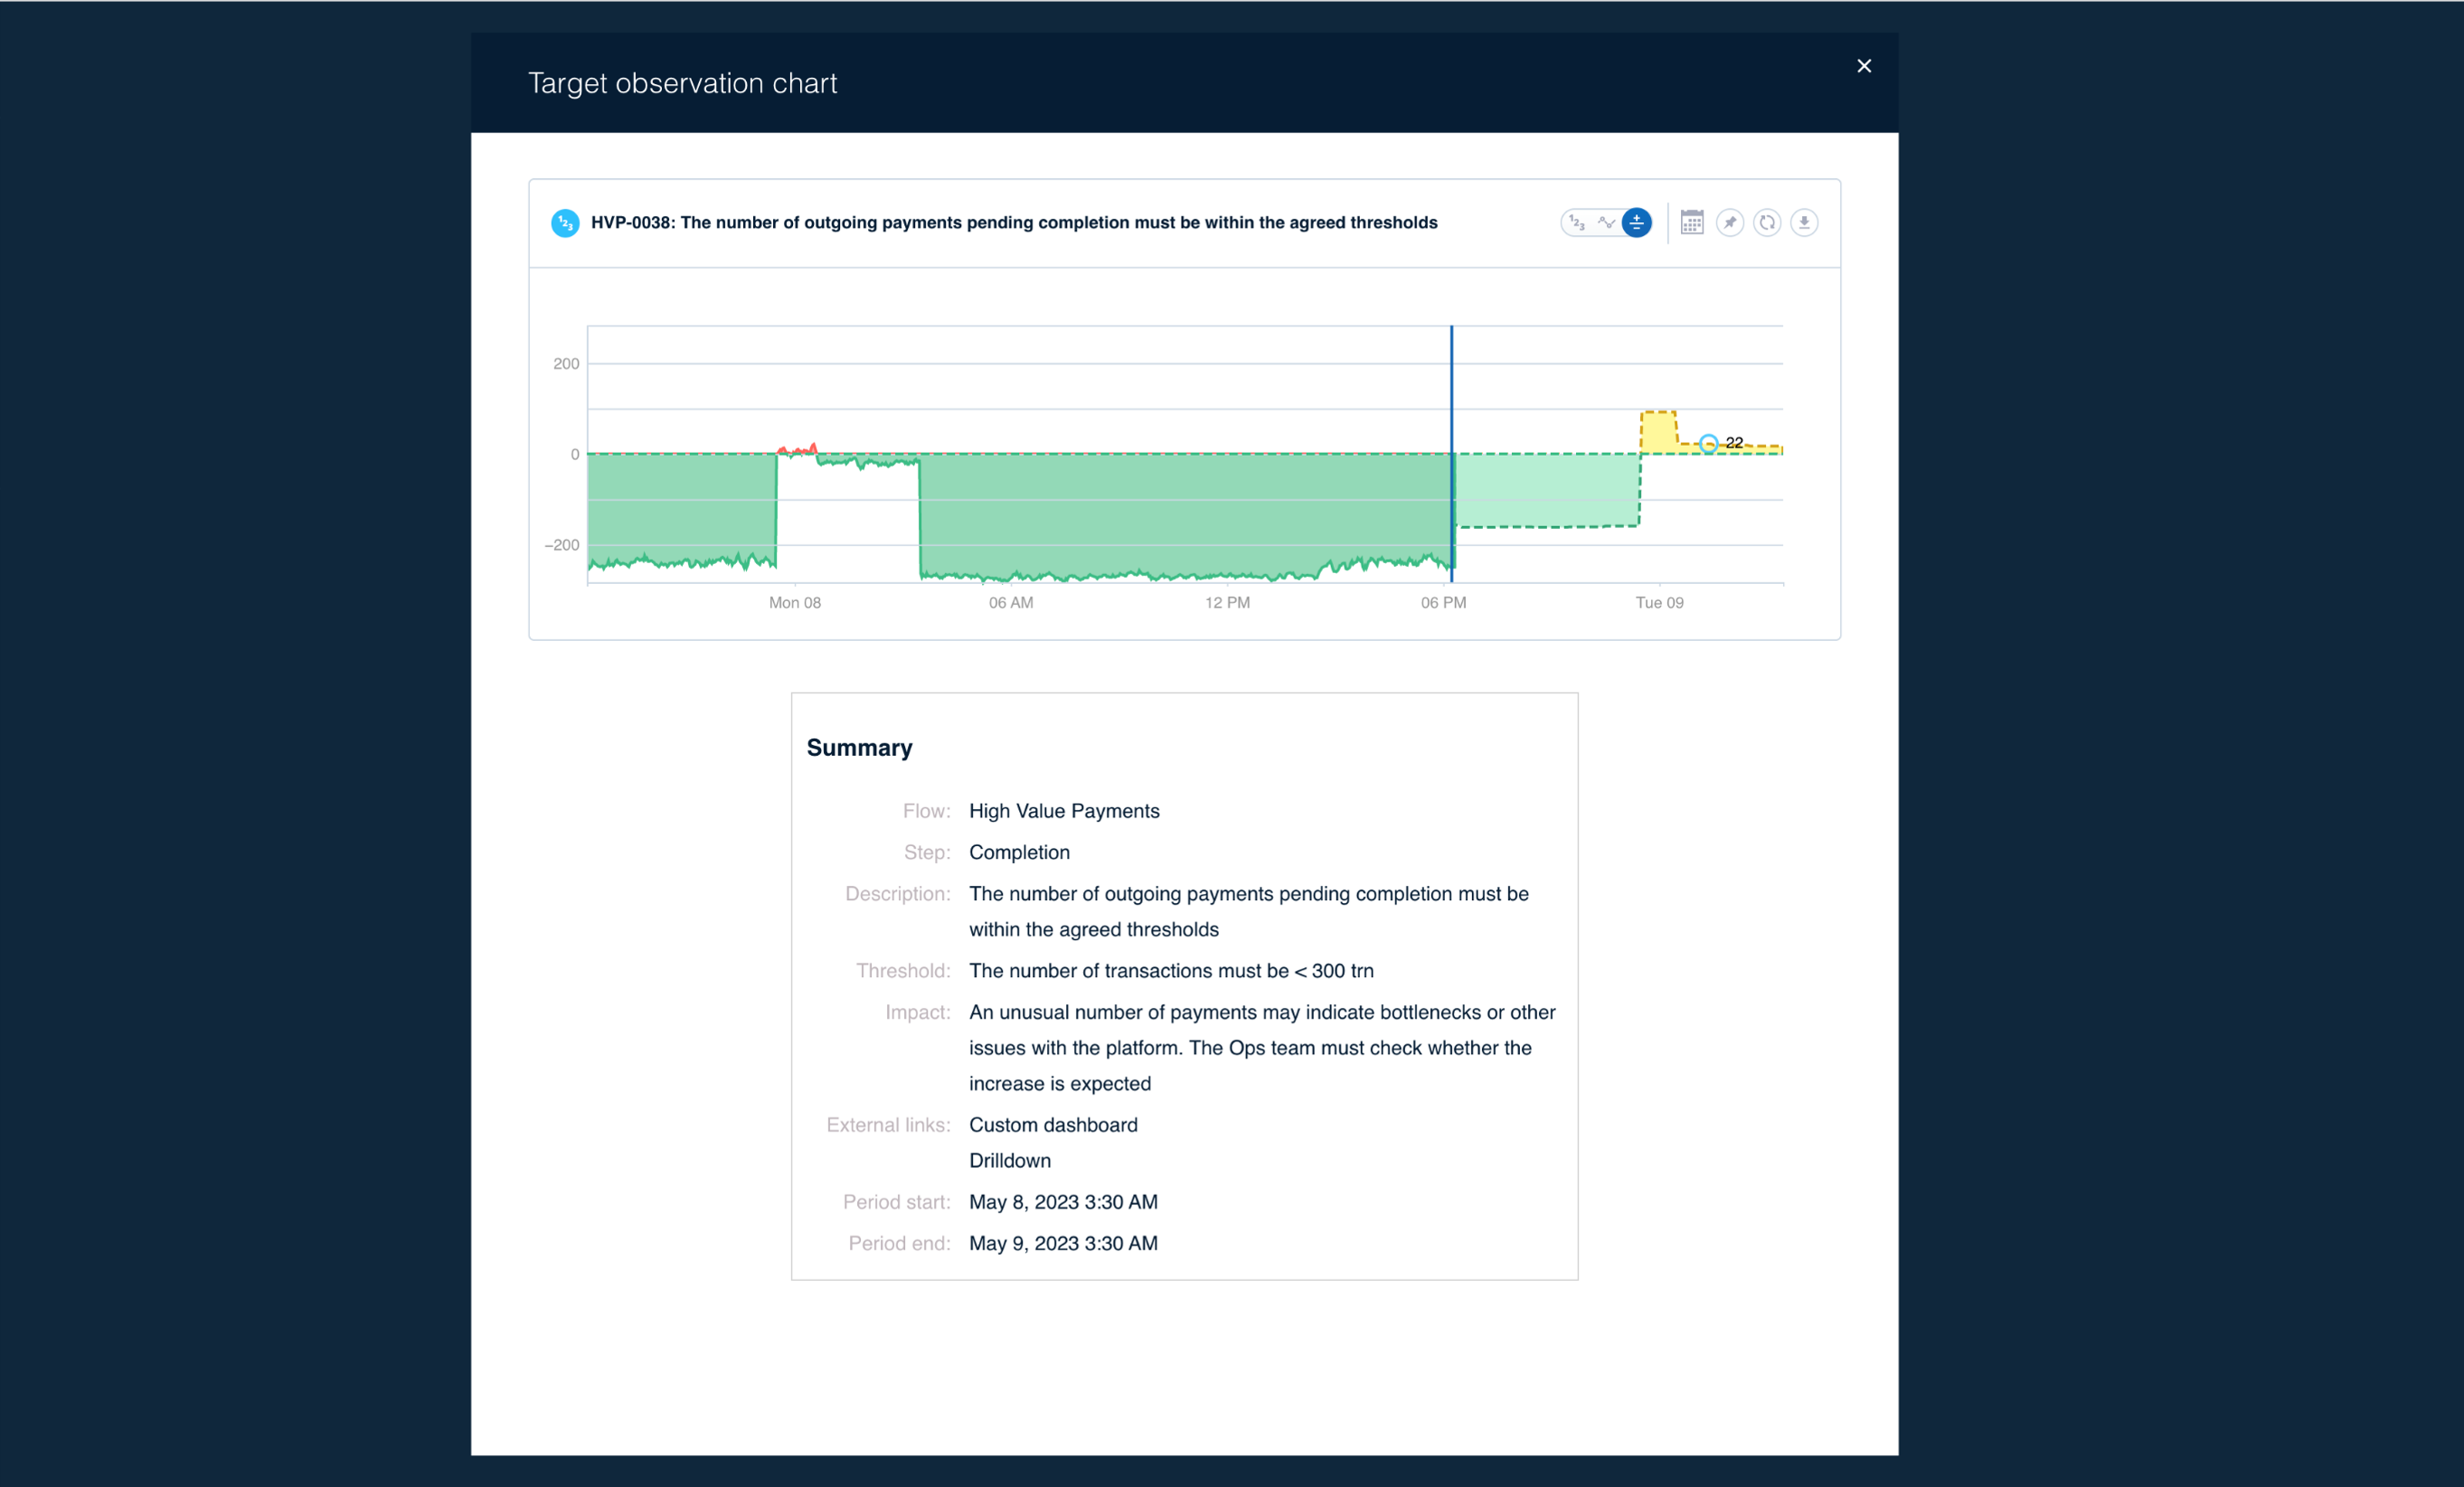
Click here to drill down to the log-level analysis.

Conduct root-cause analysis of the issue causing impact.


Select a Primary Key ID for further deep dive.
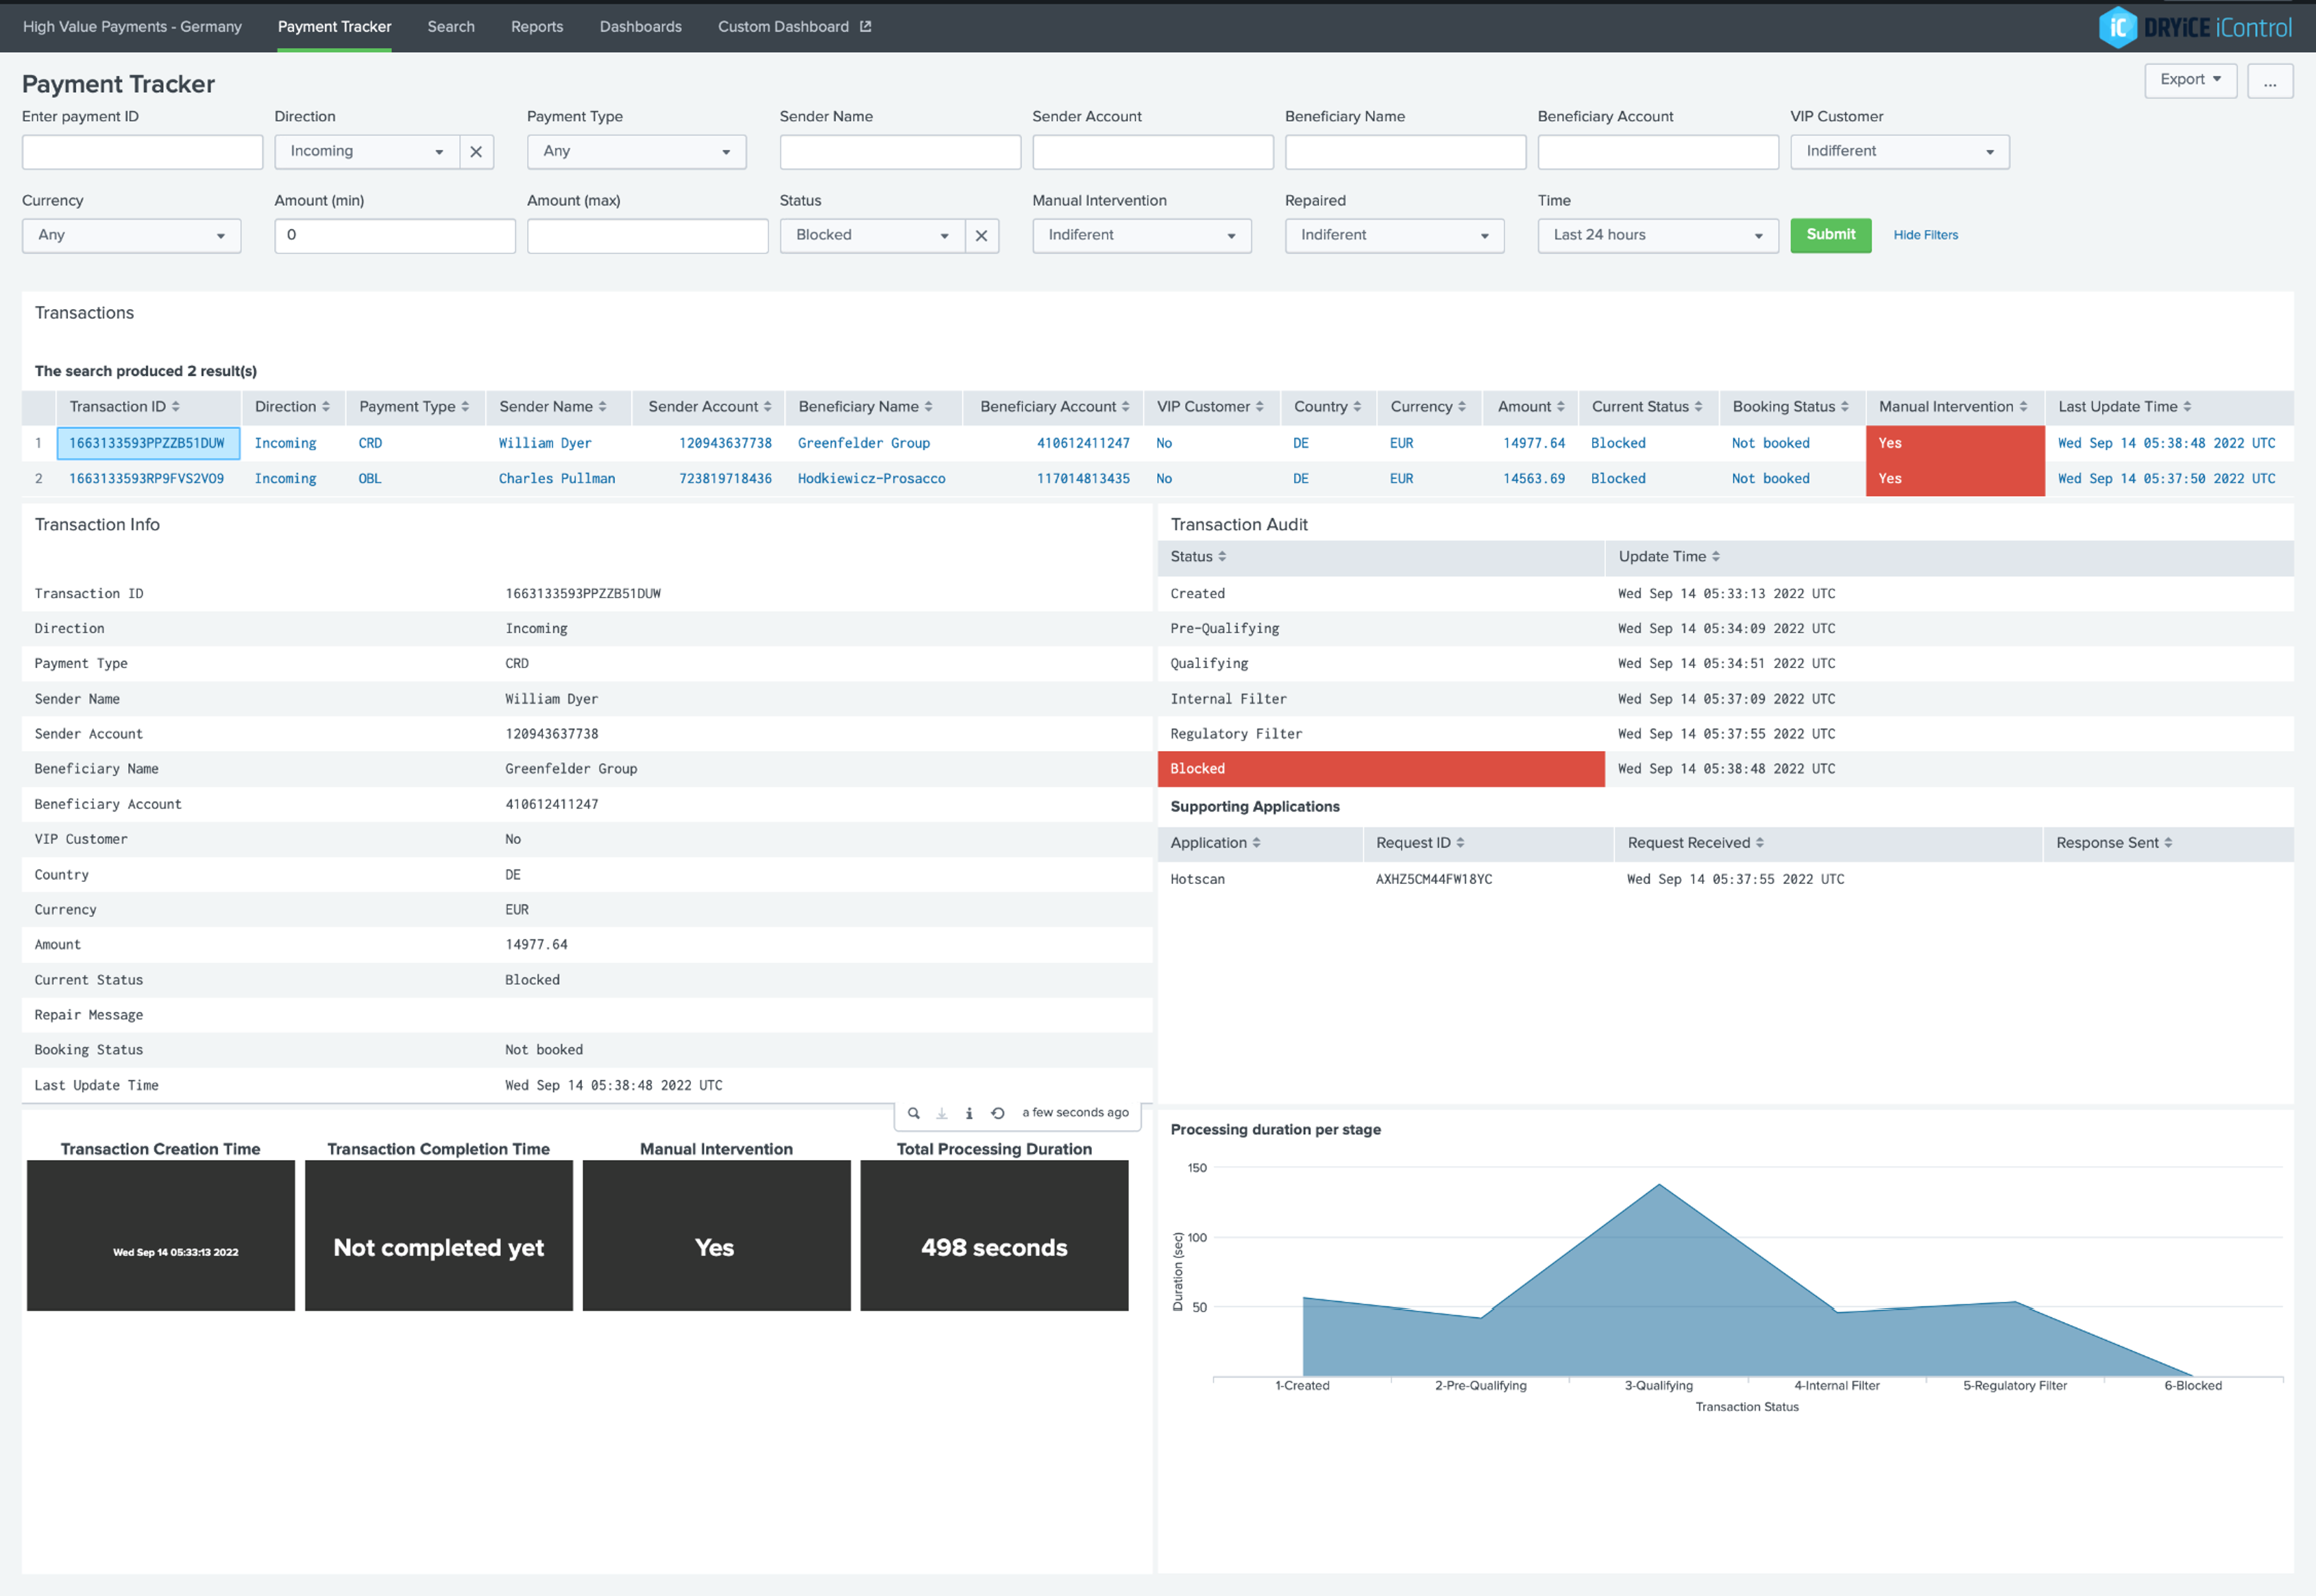
Log-level
informational
analysis of the breach.

Creating a new dashboard – To create a new dashboard, click on the ‘New tab’ button in the dashboard section and assign it a name. Then click ‘Enter’.
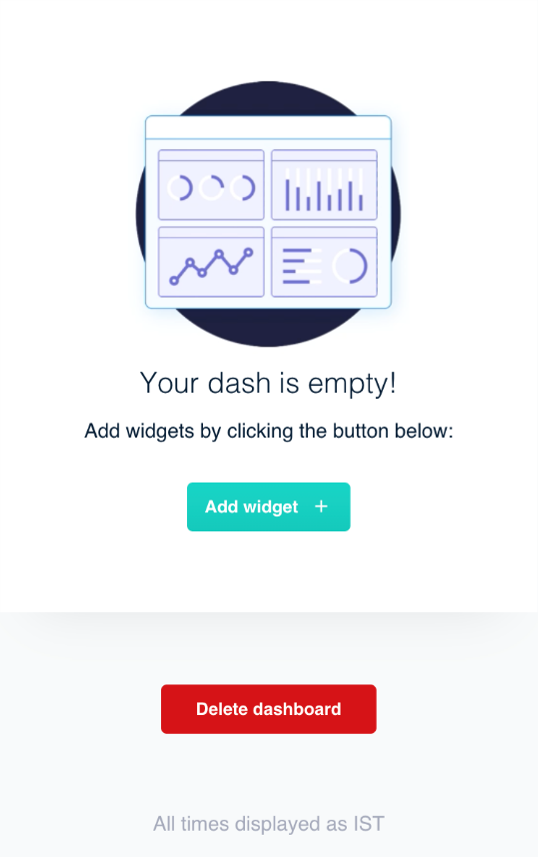
A new empty dashboard will be created. You can click on ‘Add widget’ button to add multiple widgets customized as per your preferences.
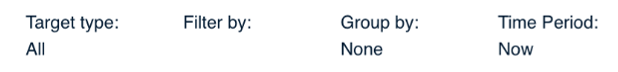
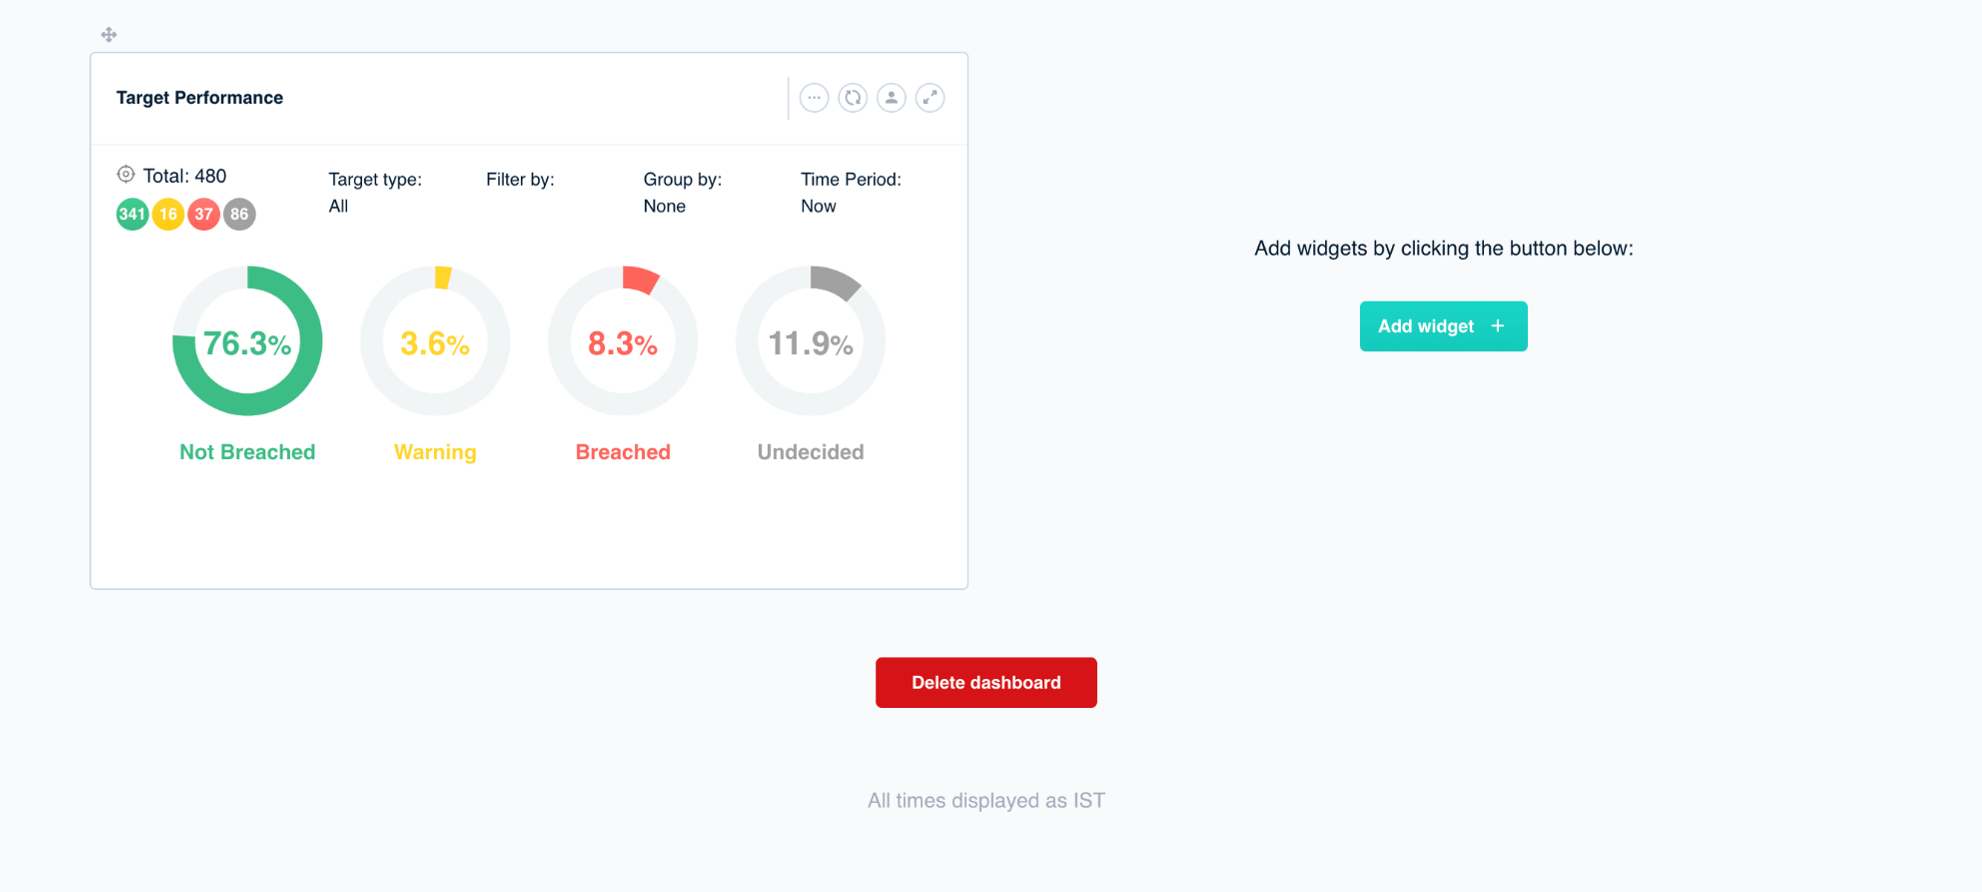
You can slice and dice the data in widgets using the given filtration buttons. The widget will automatically change to represent the data in best adaptable format based on the filters selected.


New Flow - Enables the users to create a new business flow
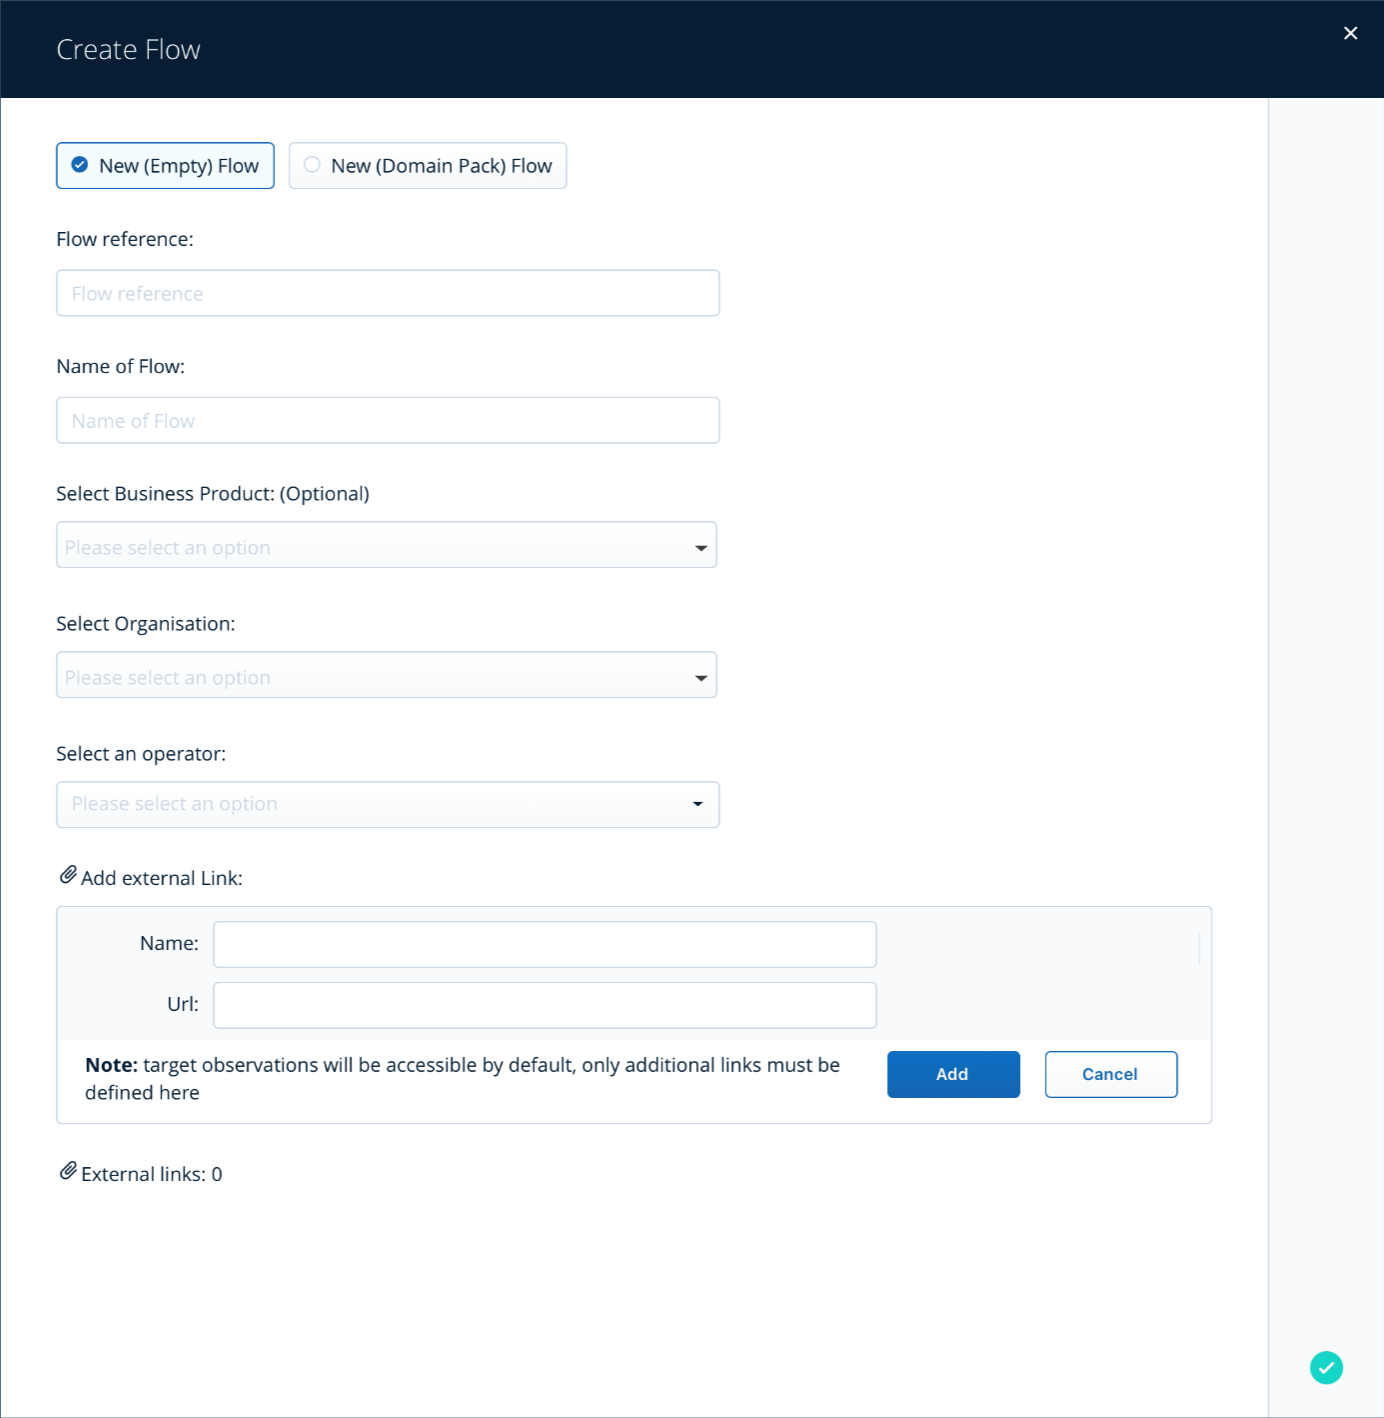
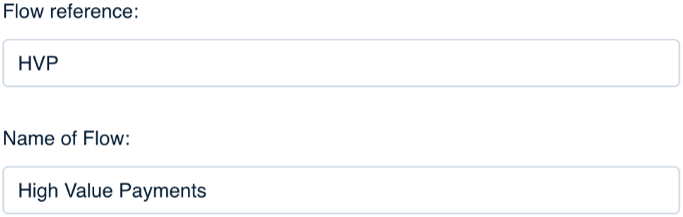
Assign the new flow a ‘Flow Reference’ and a ‘Name’

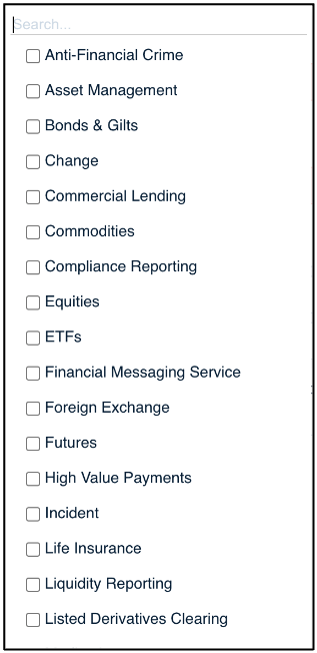
Select a Business Product from the populated list and assign a weightage to it
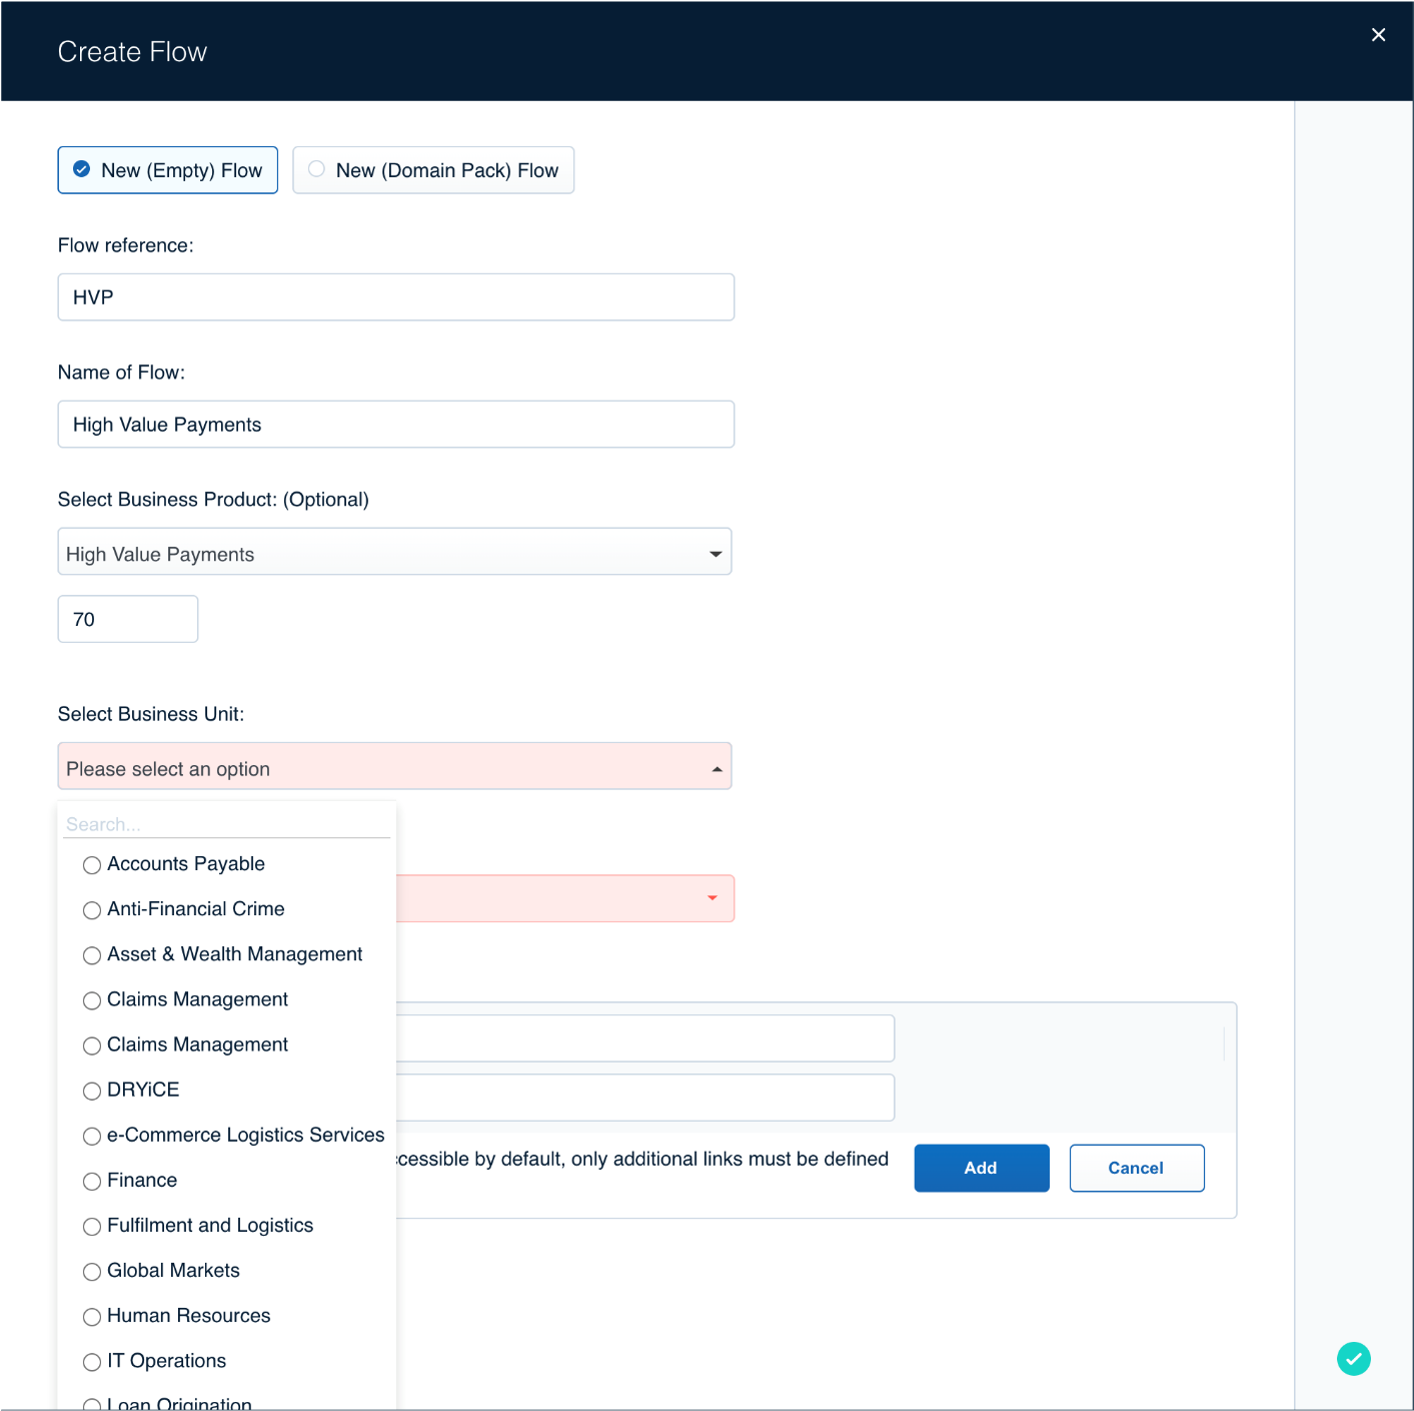
Select a Business Unit from the populated list and assign a weightage to it
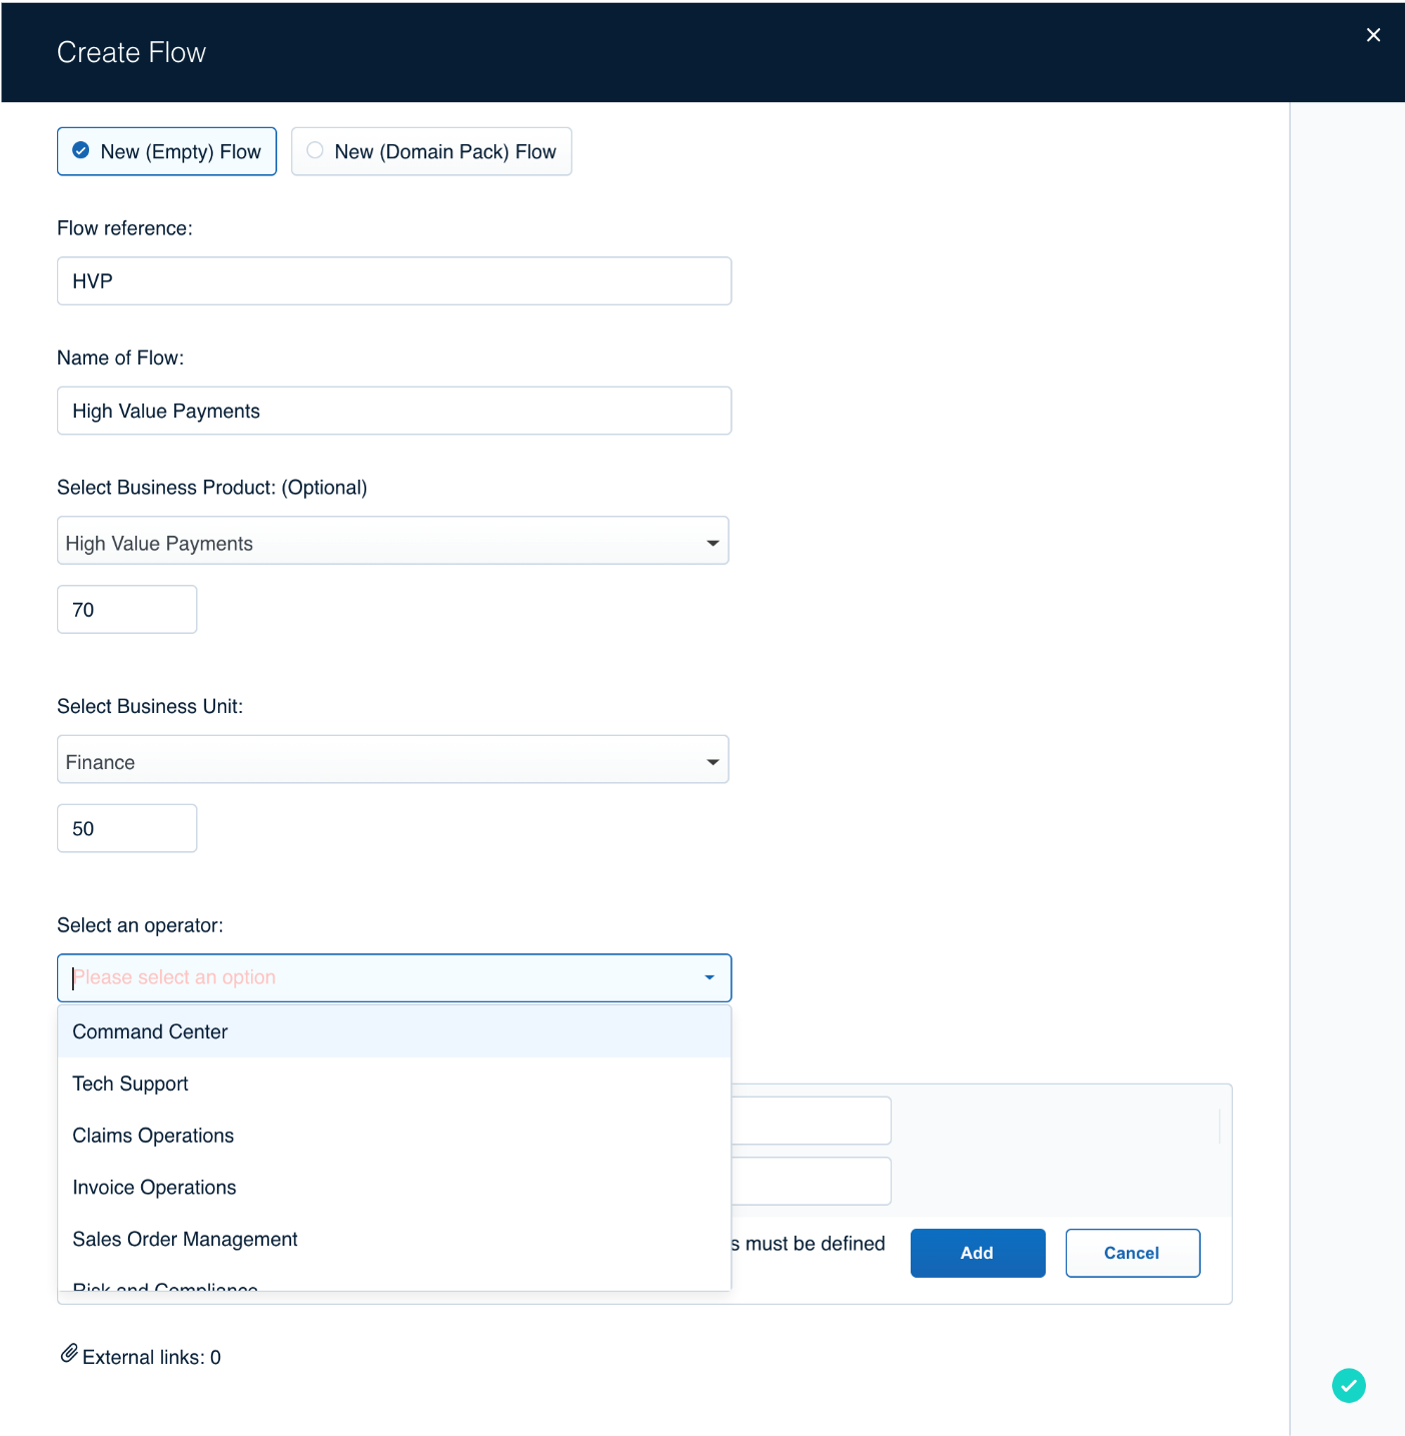
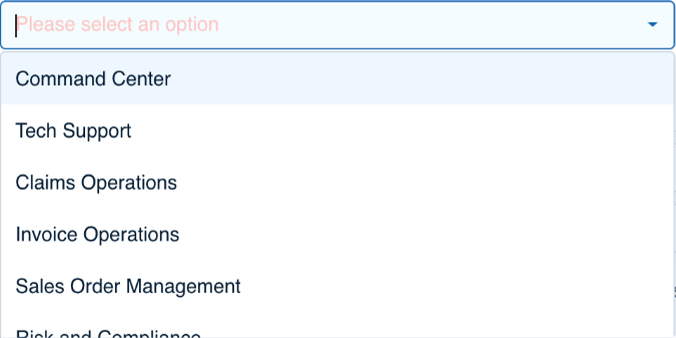
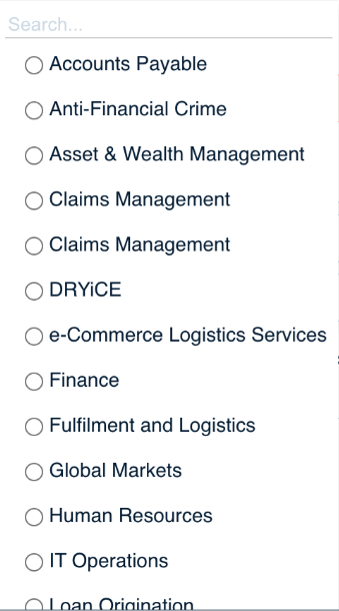
Select an Operator from the populated list
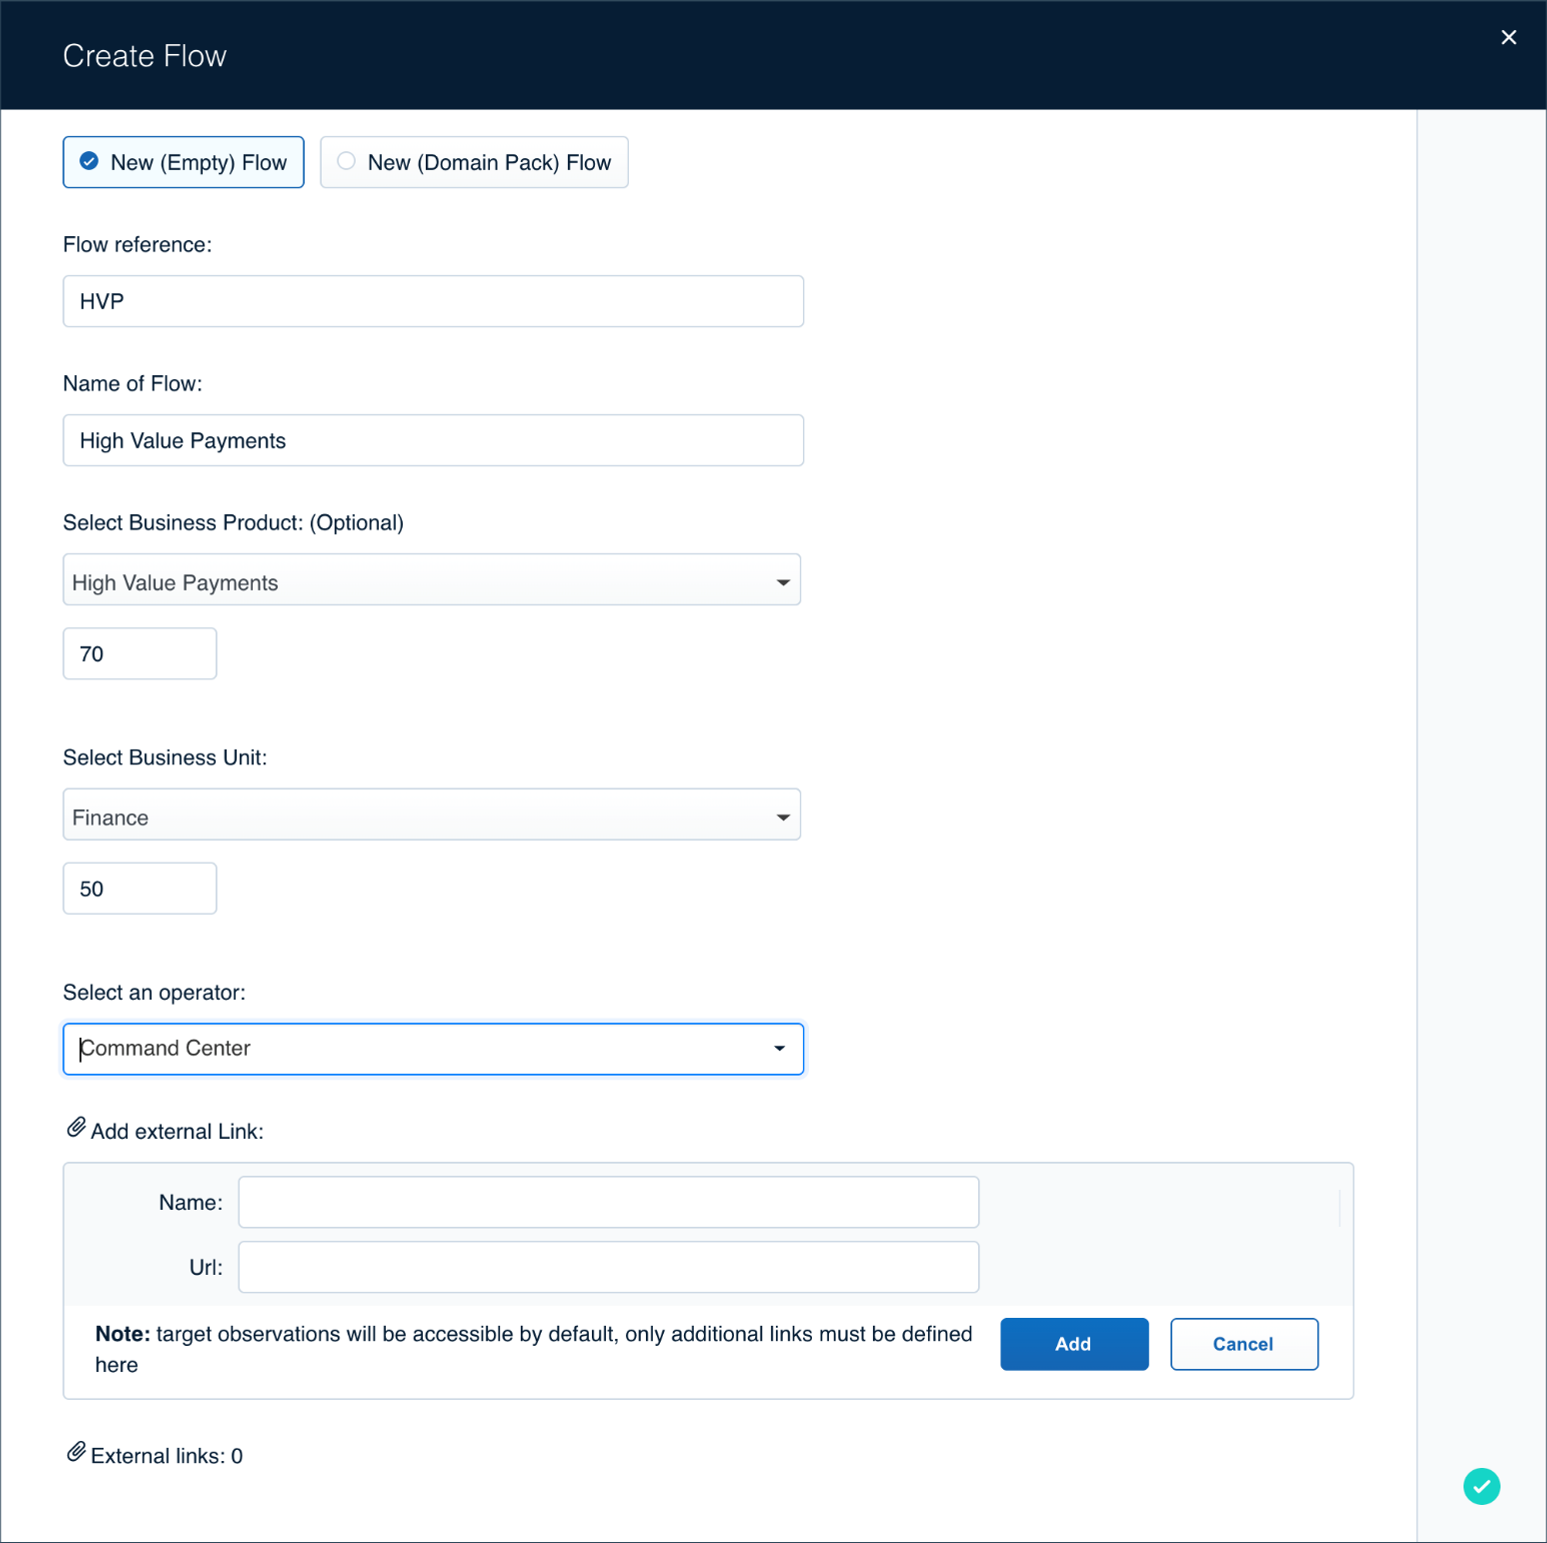

Click on Save after filling the pre-requisite information.

 New
(Domain Pack) Flow
New
(Domain Pack) Flow
New (Domain Pack) Flow - Enables the users to leverage out-of-box industry solutions available to configure the business flows with a click. It is generally quicker to start with one of our out-of-the-box flows and just edit it to suit your requirements.
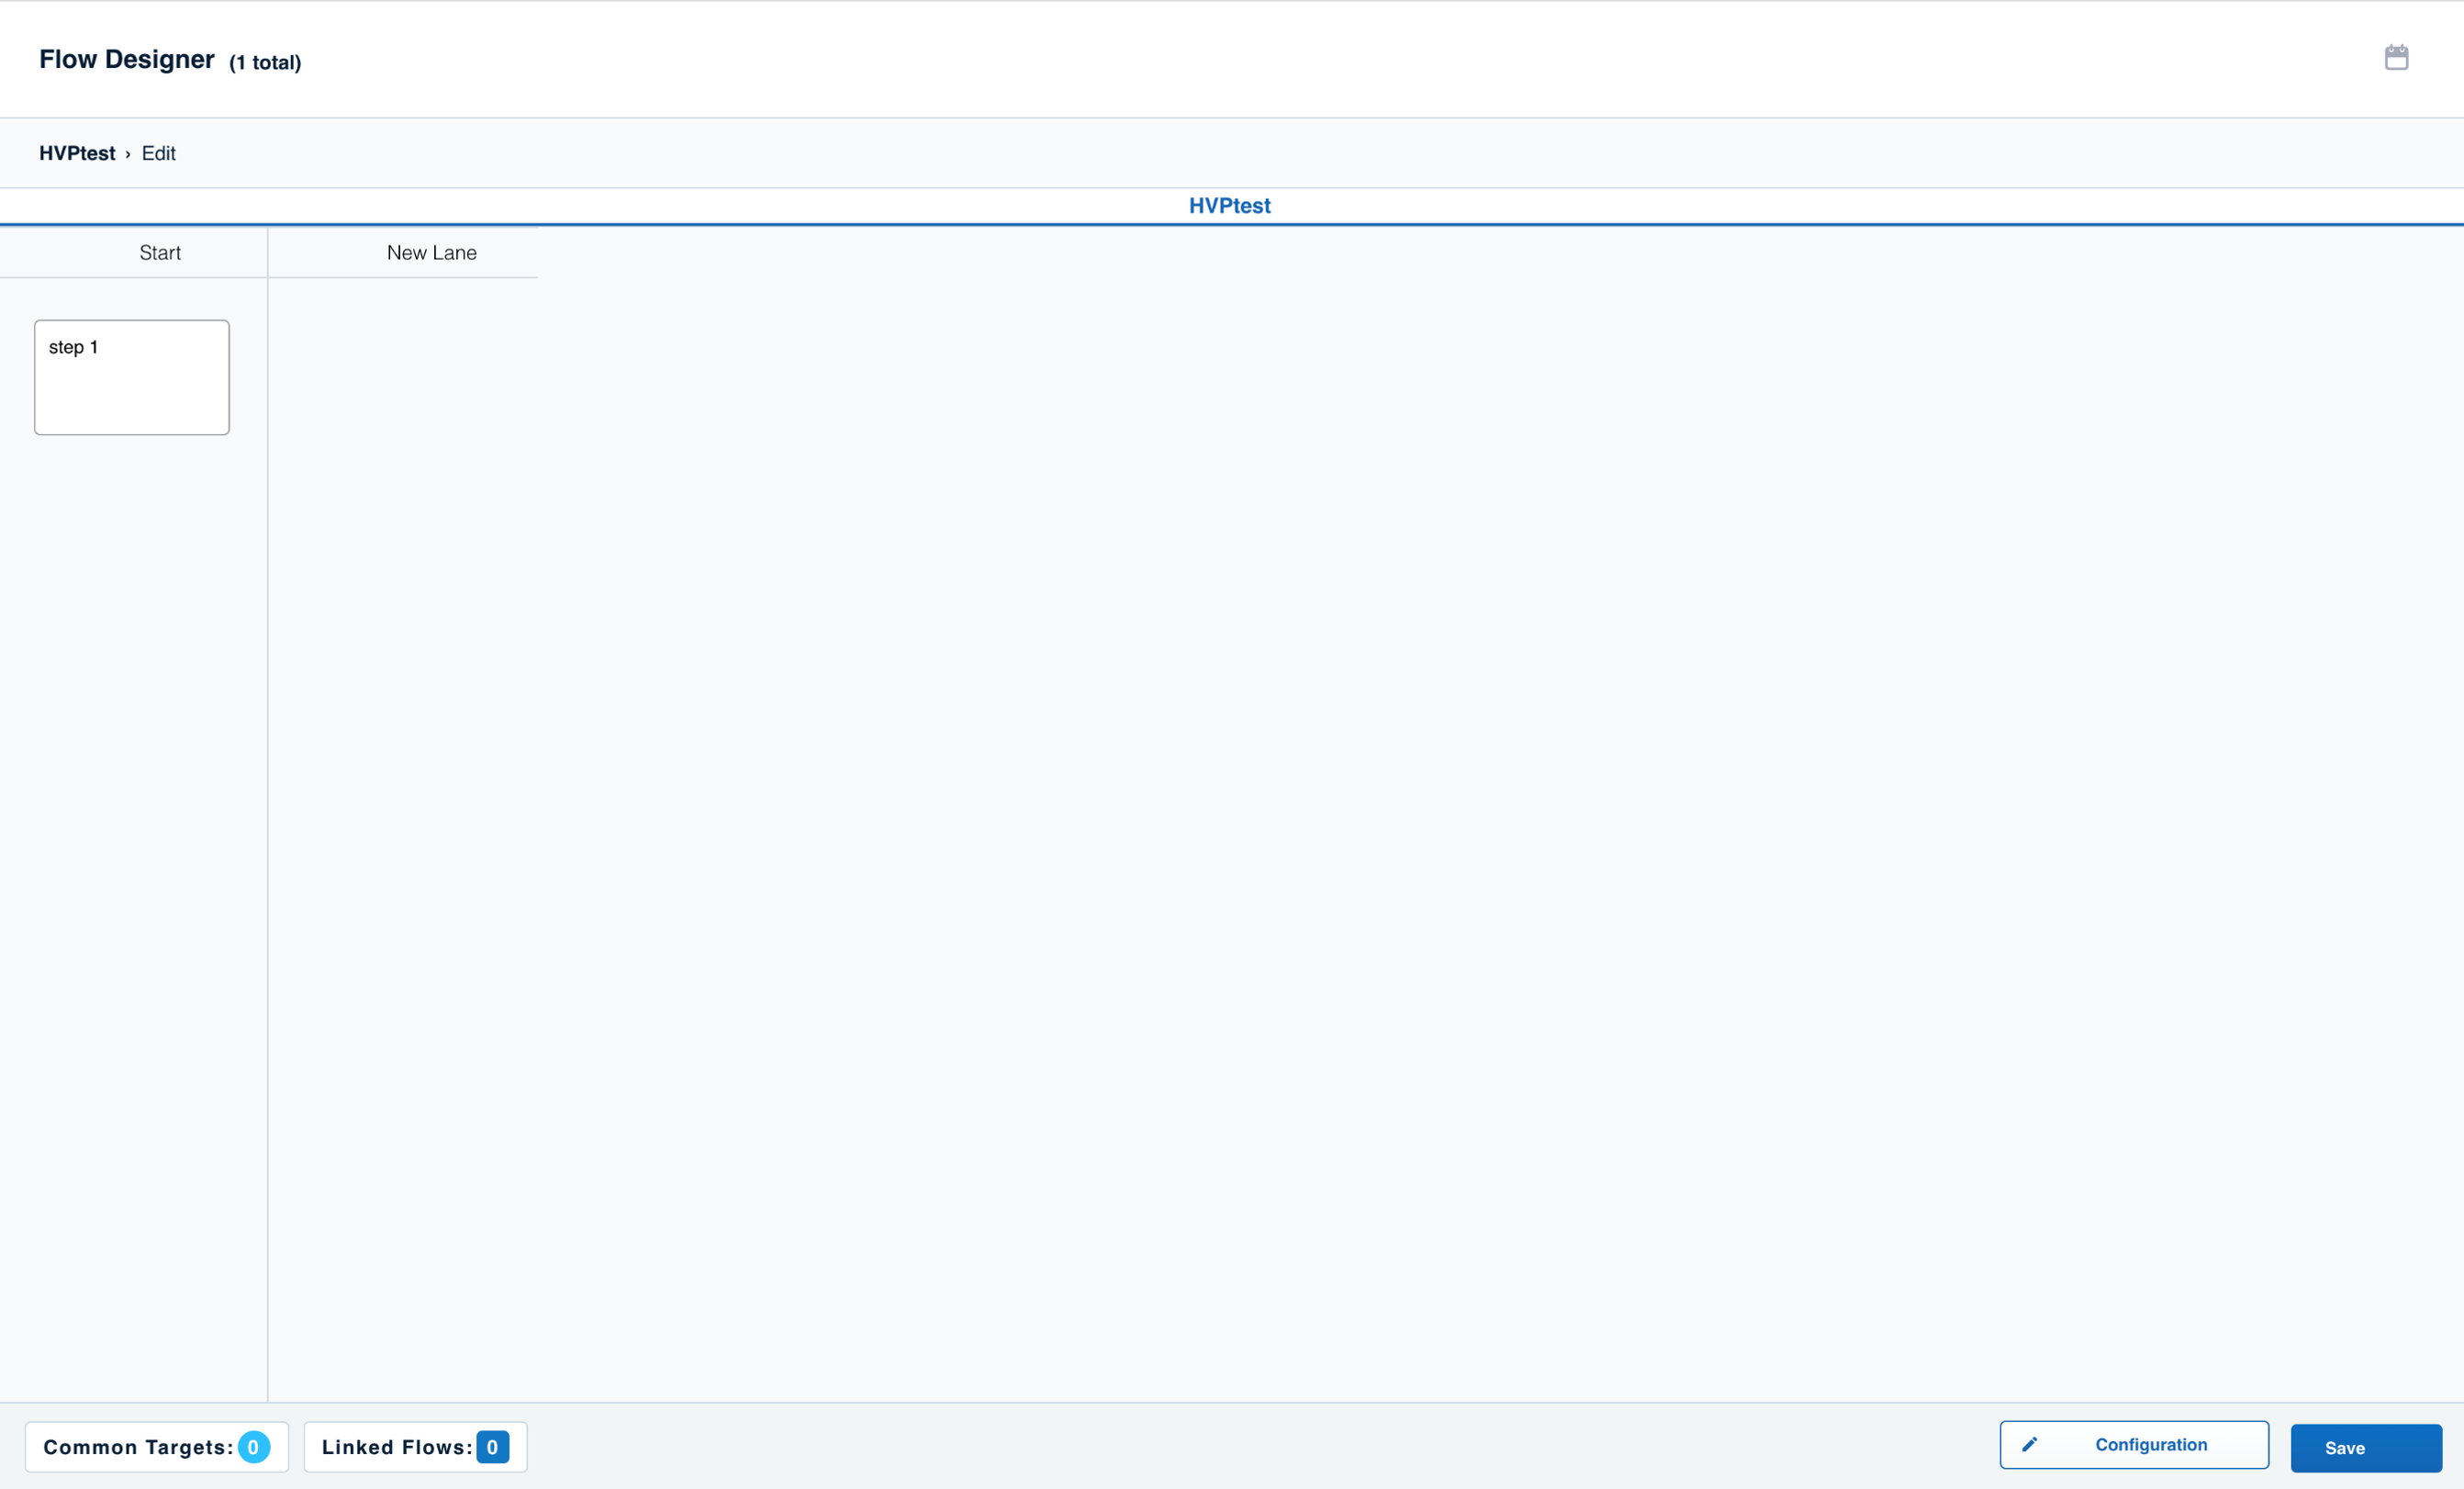


.png)
Click on the step to add a Target/Child Flow to it.
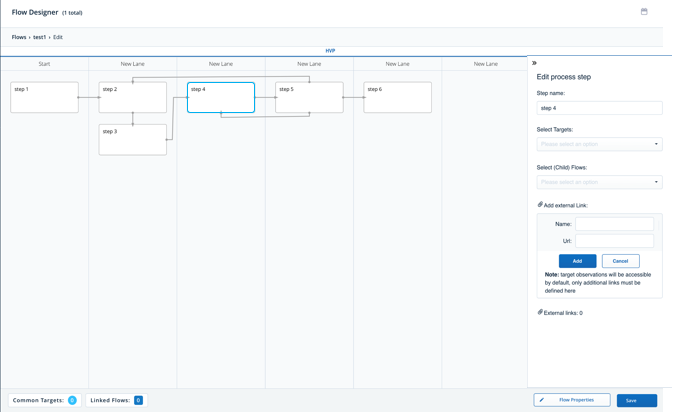
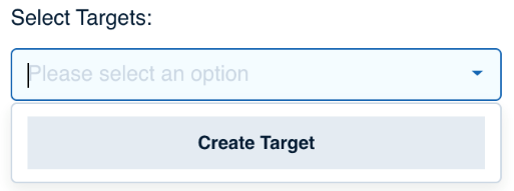
Click on Create Target to create a target mapped to the selected step.
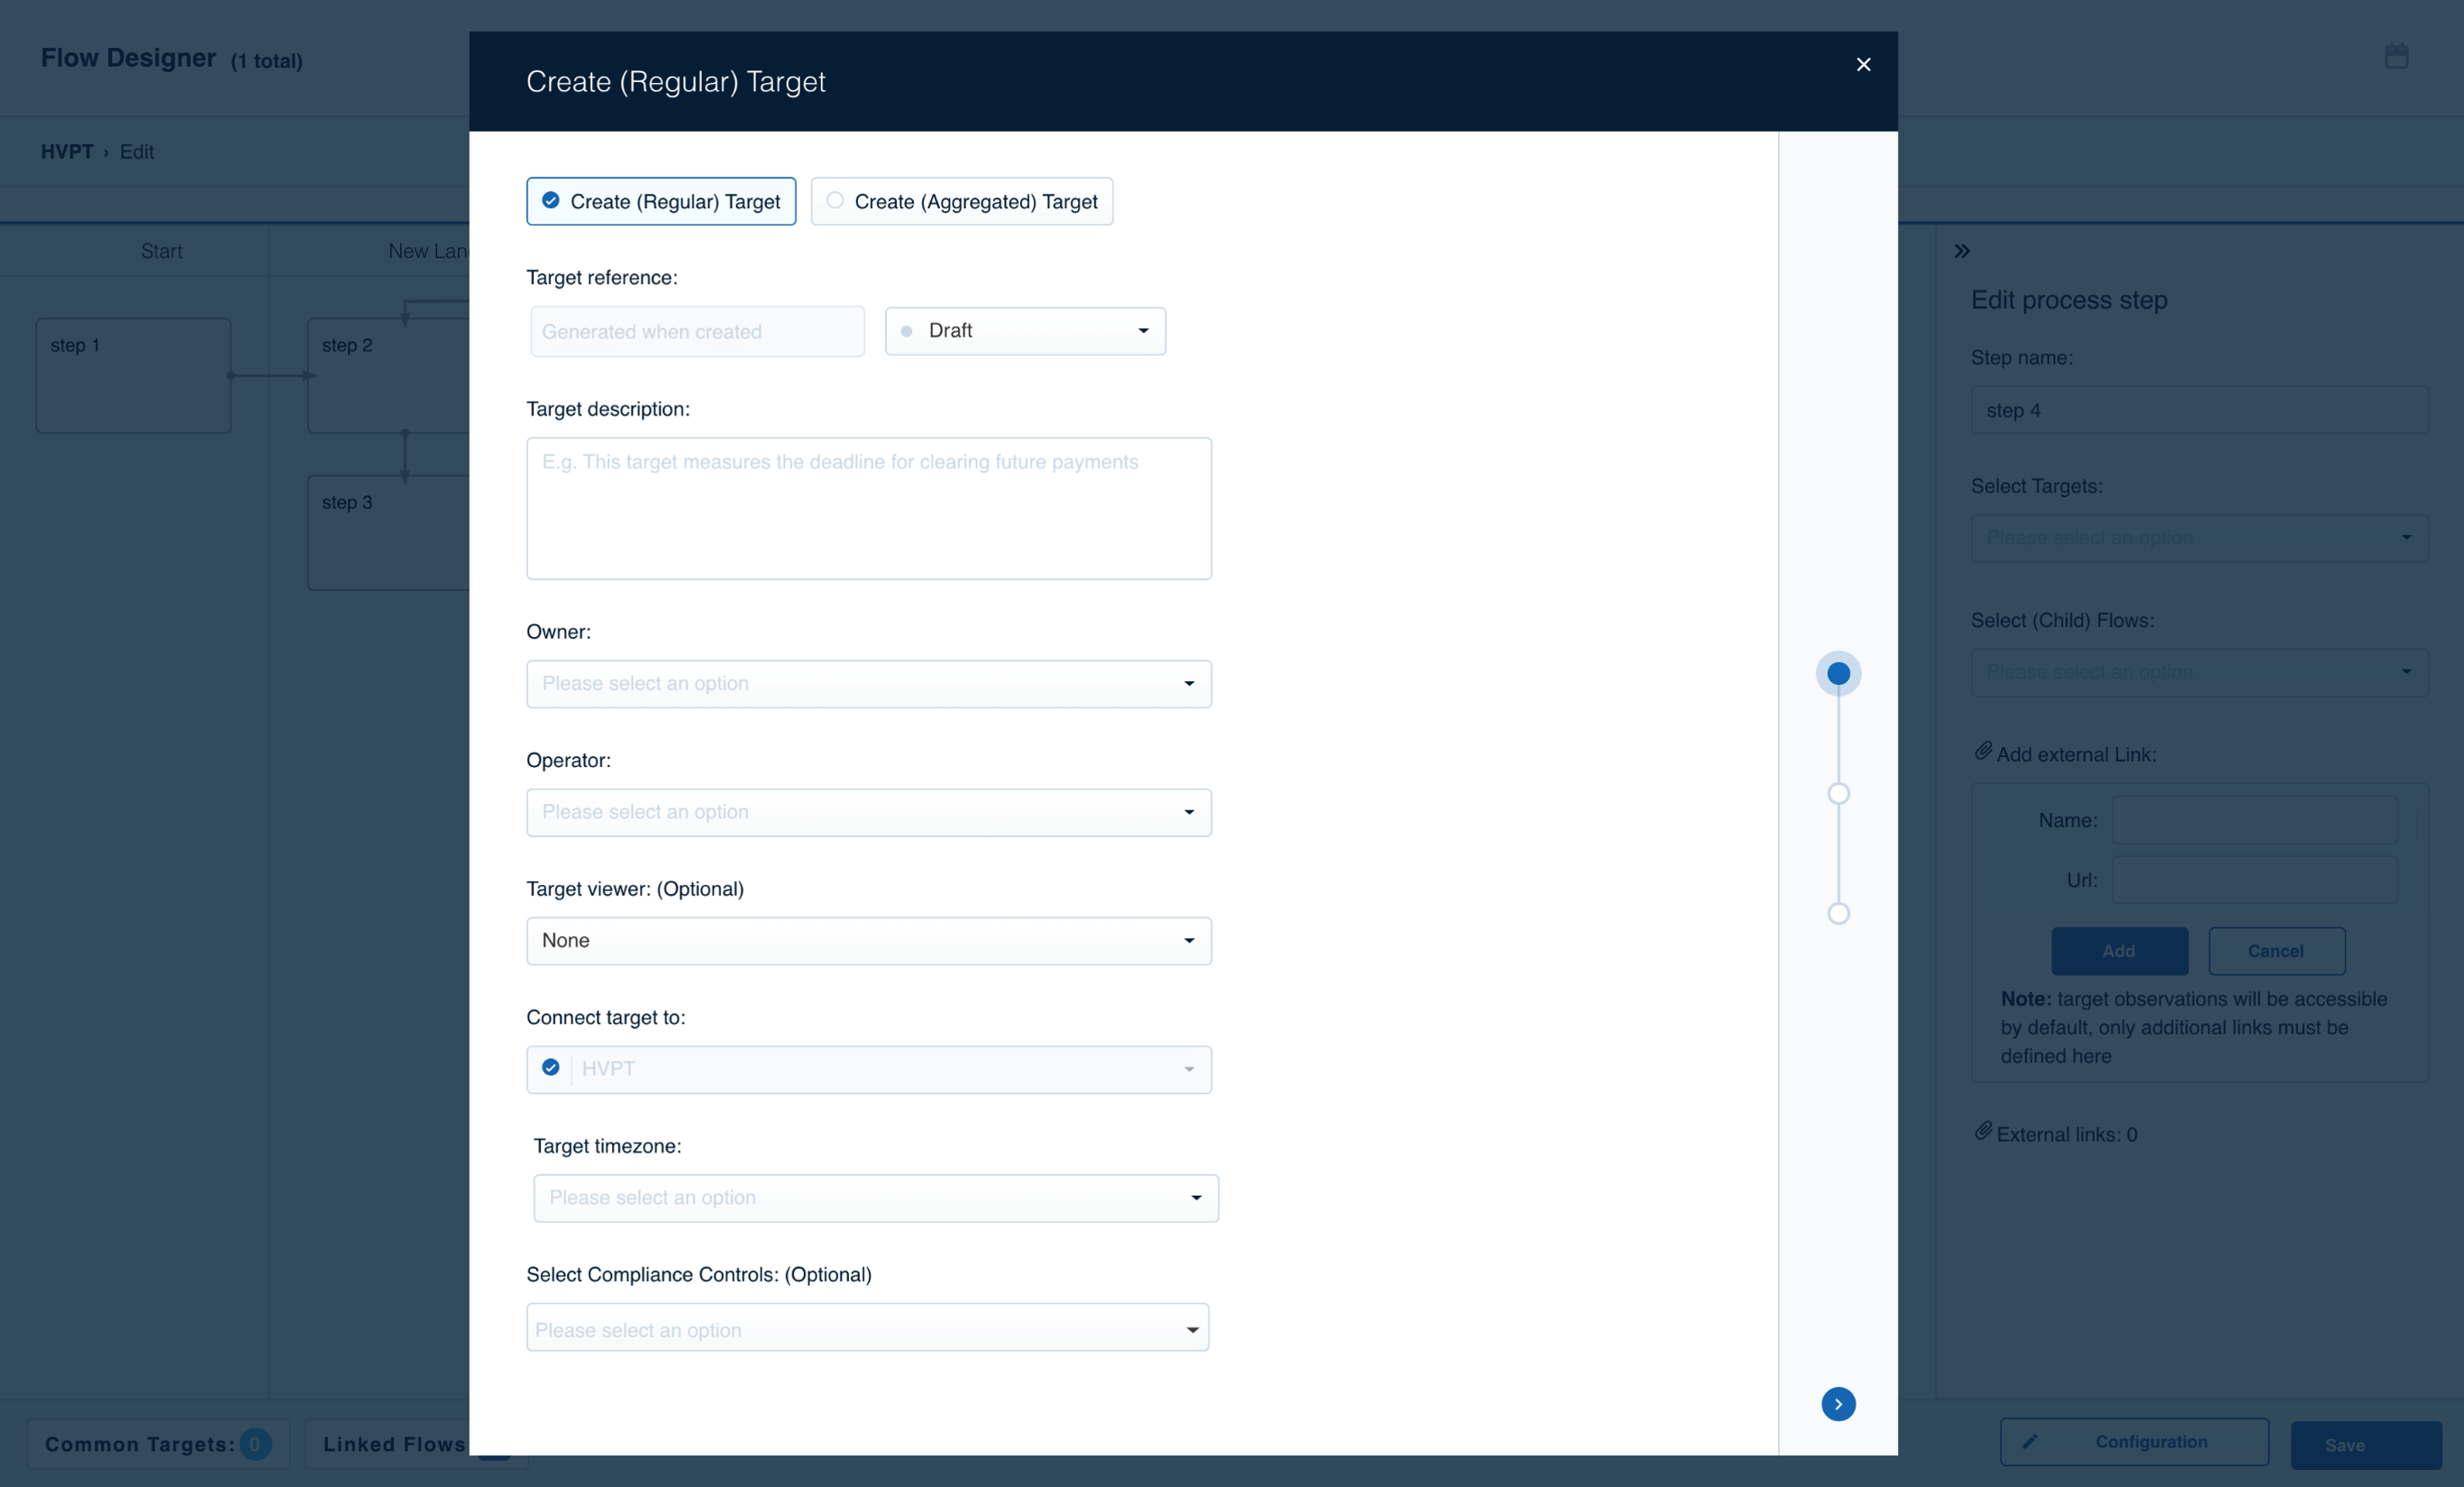
We fill in the target description.

Adding the target owner
– Stakeholder responsible for the target health.

Adding the target operator
- Team responsible for the
target health.
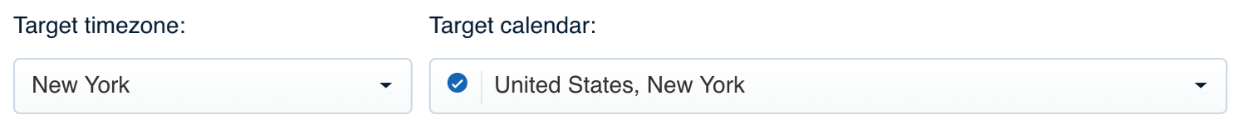
Select the timezone & calendar.
.png)
Click Here.
.png)
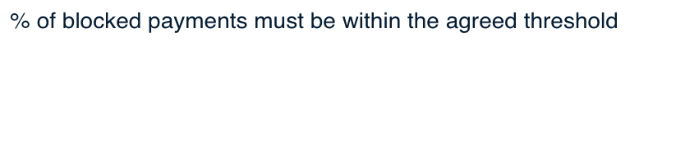
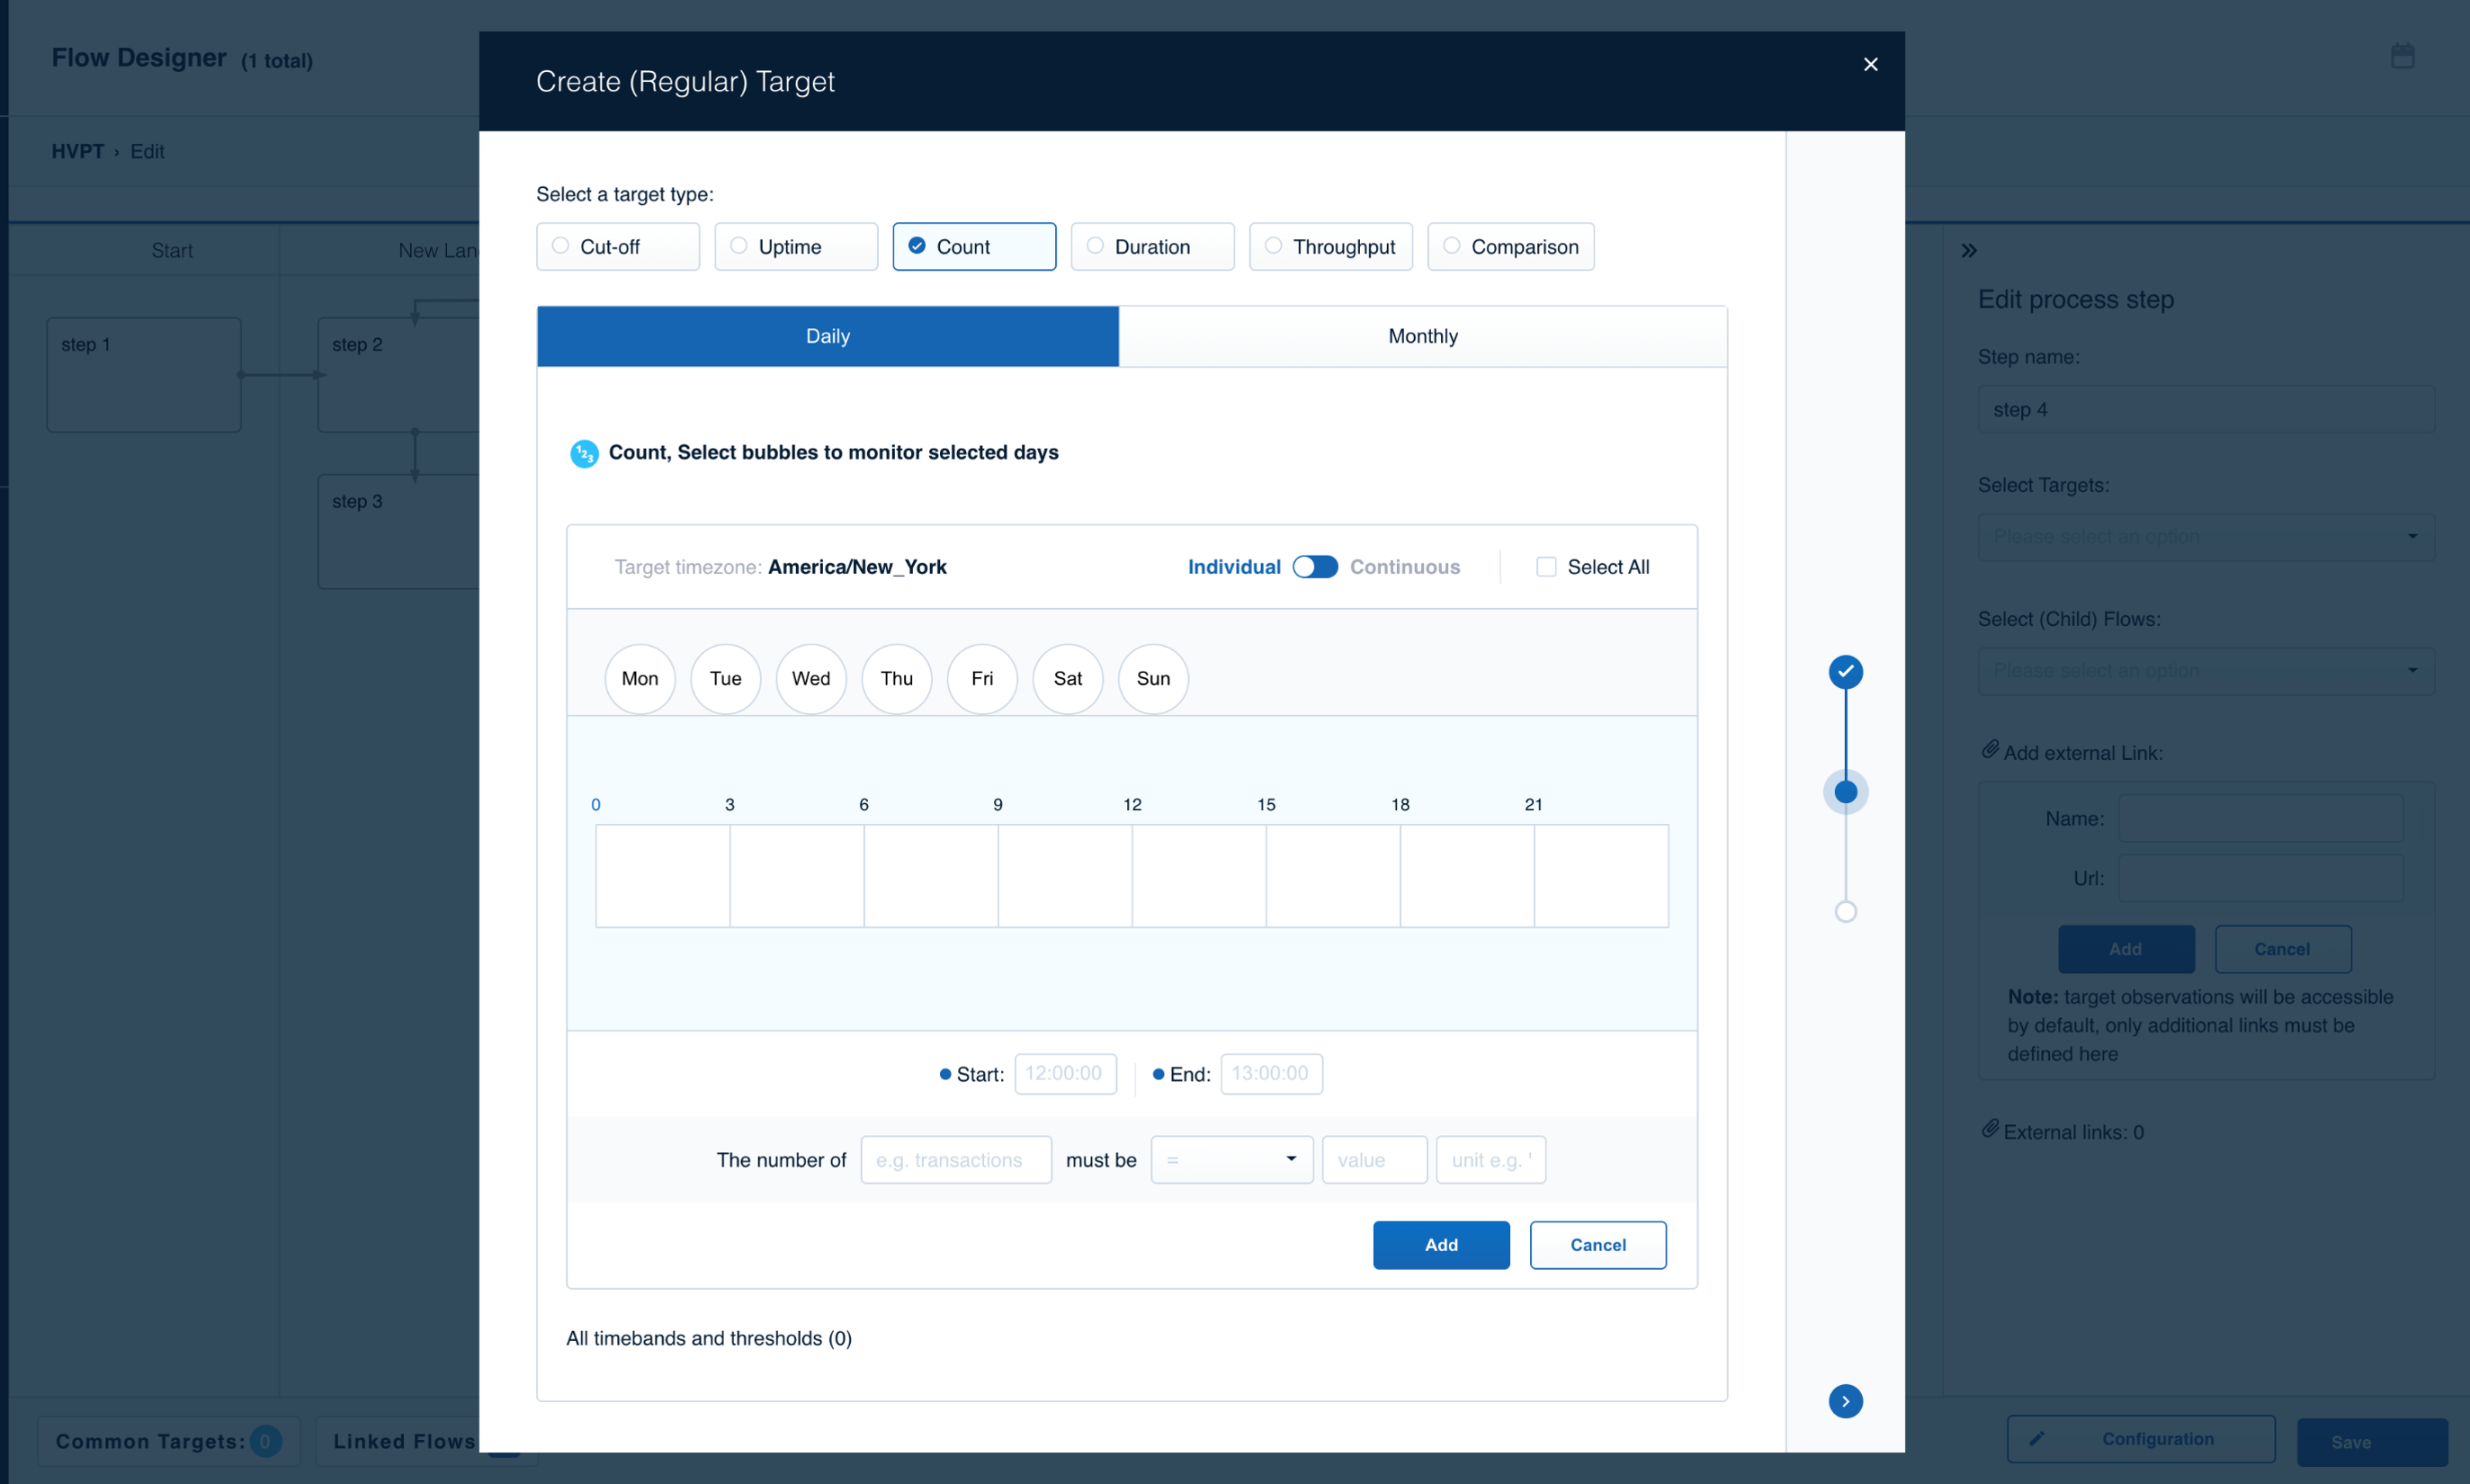
We will select one of the six target types.
.png)
There are two time cycles for accurate monitoring – Daily/Monthly
.png)
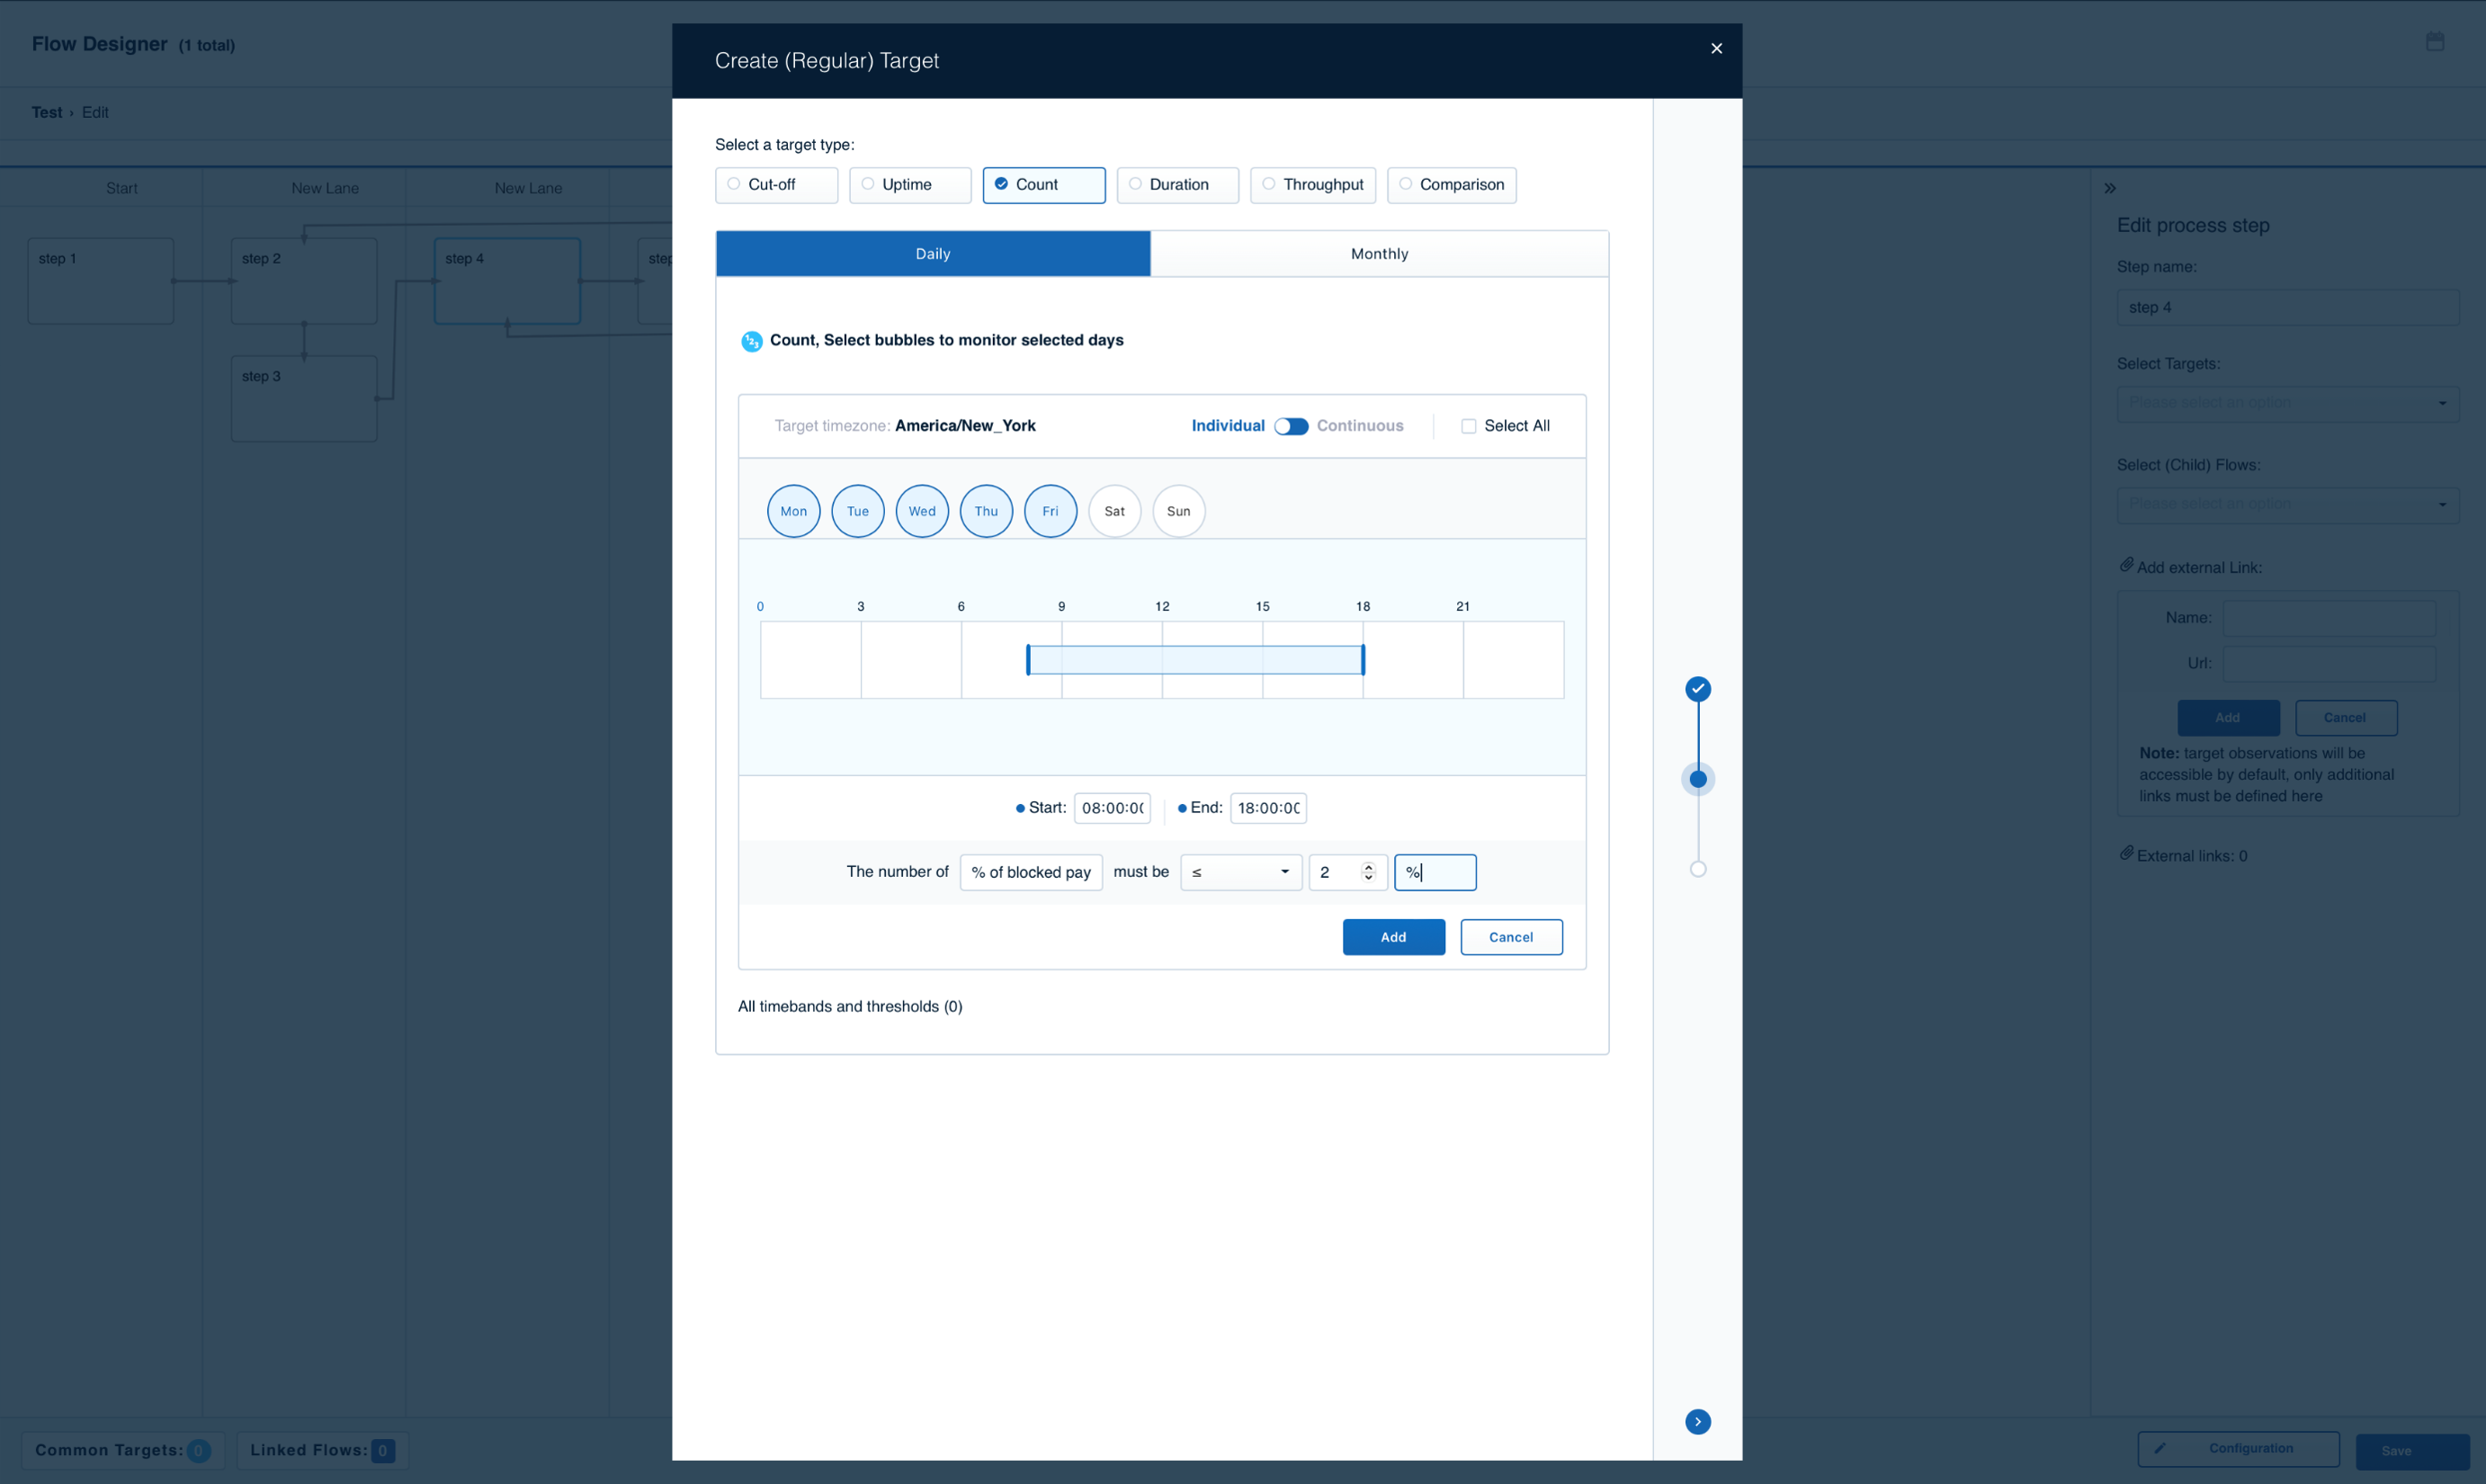
Specific days or months can be selected.
.png)
We can be very customized with the active time for monitoring.
.png)
Click on Add.
Click Next.
.png)
.png)
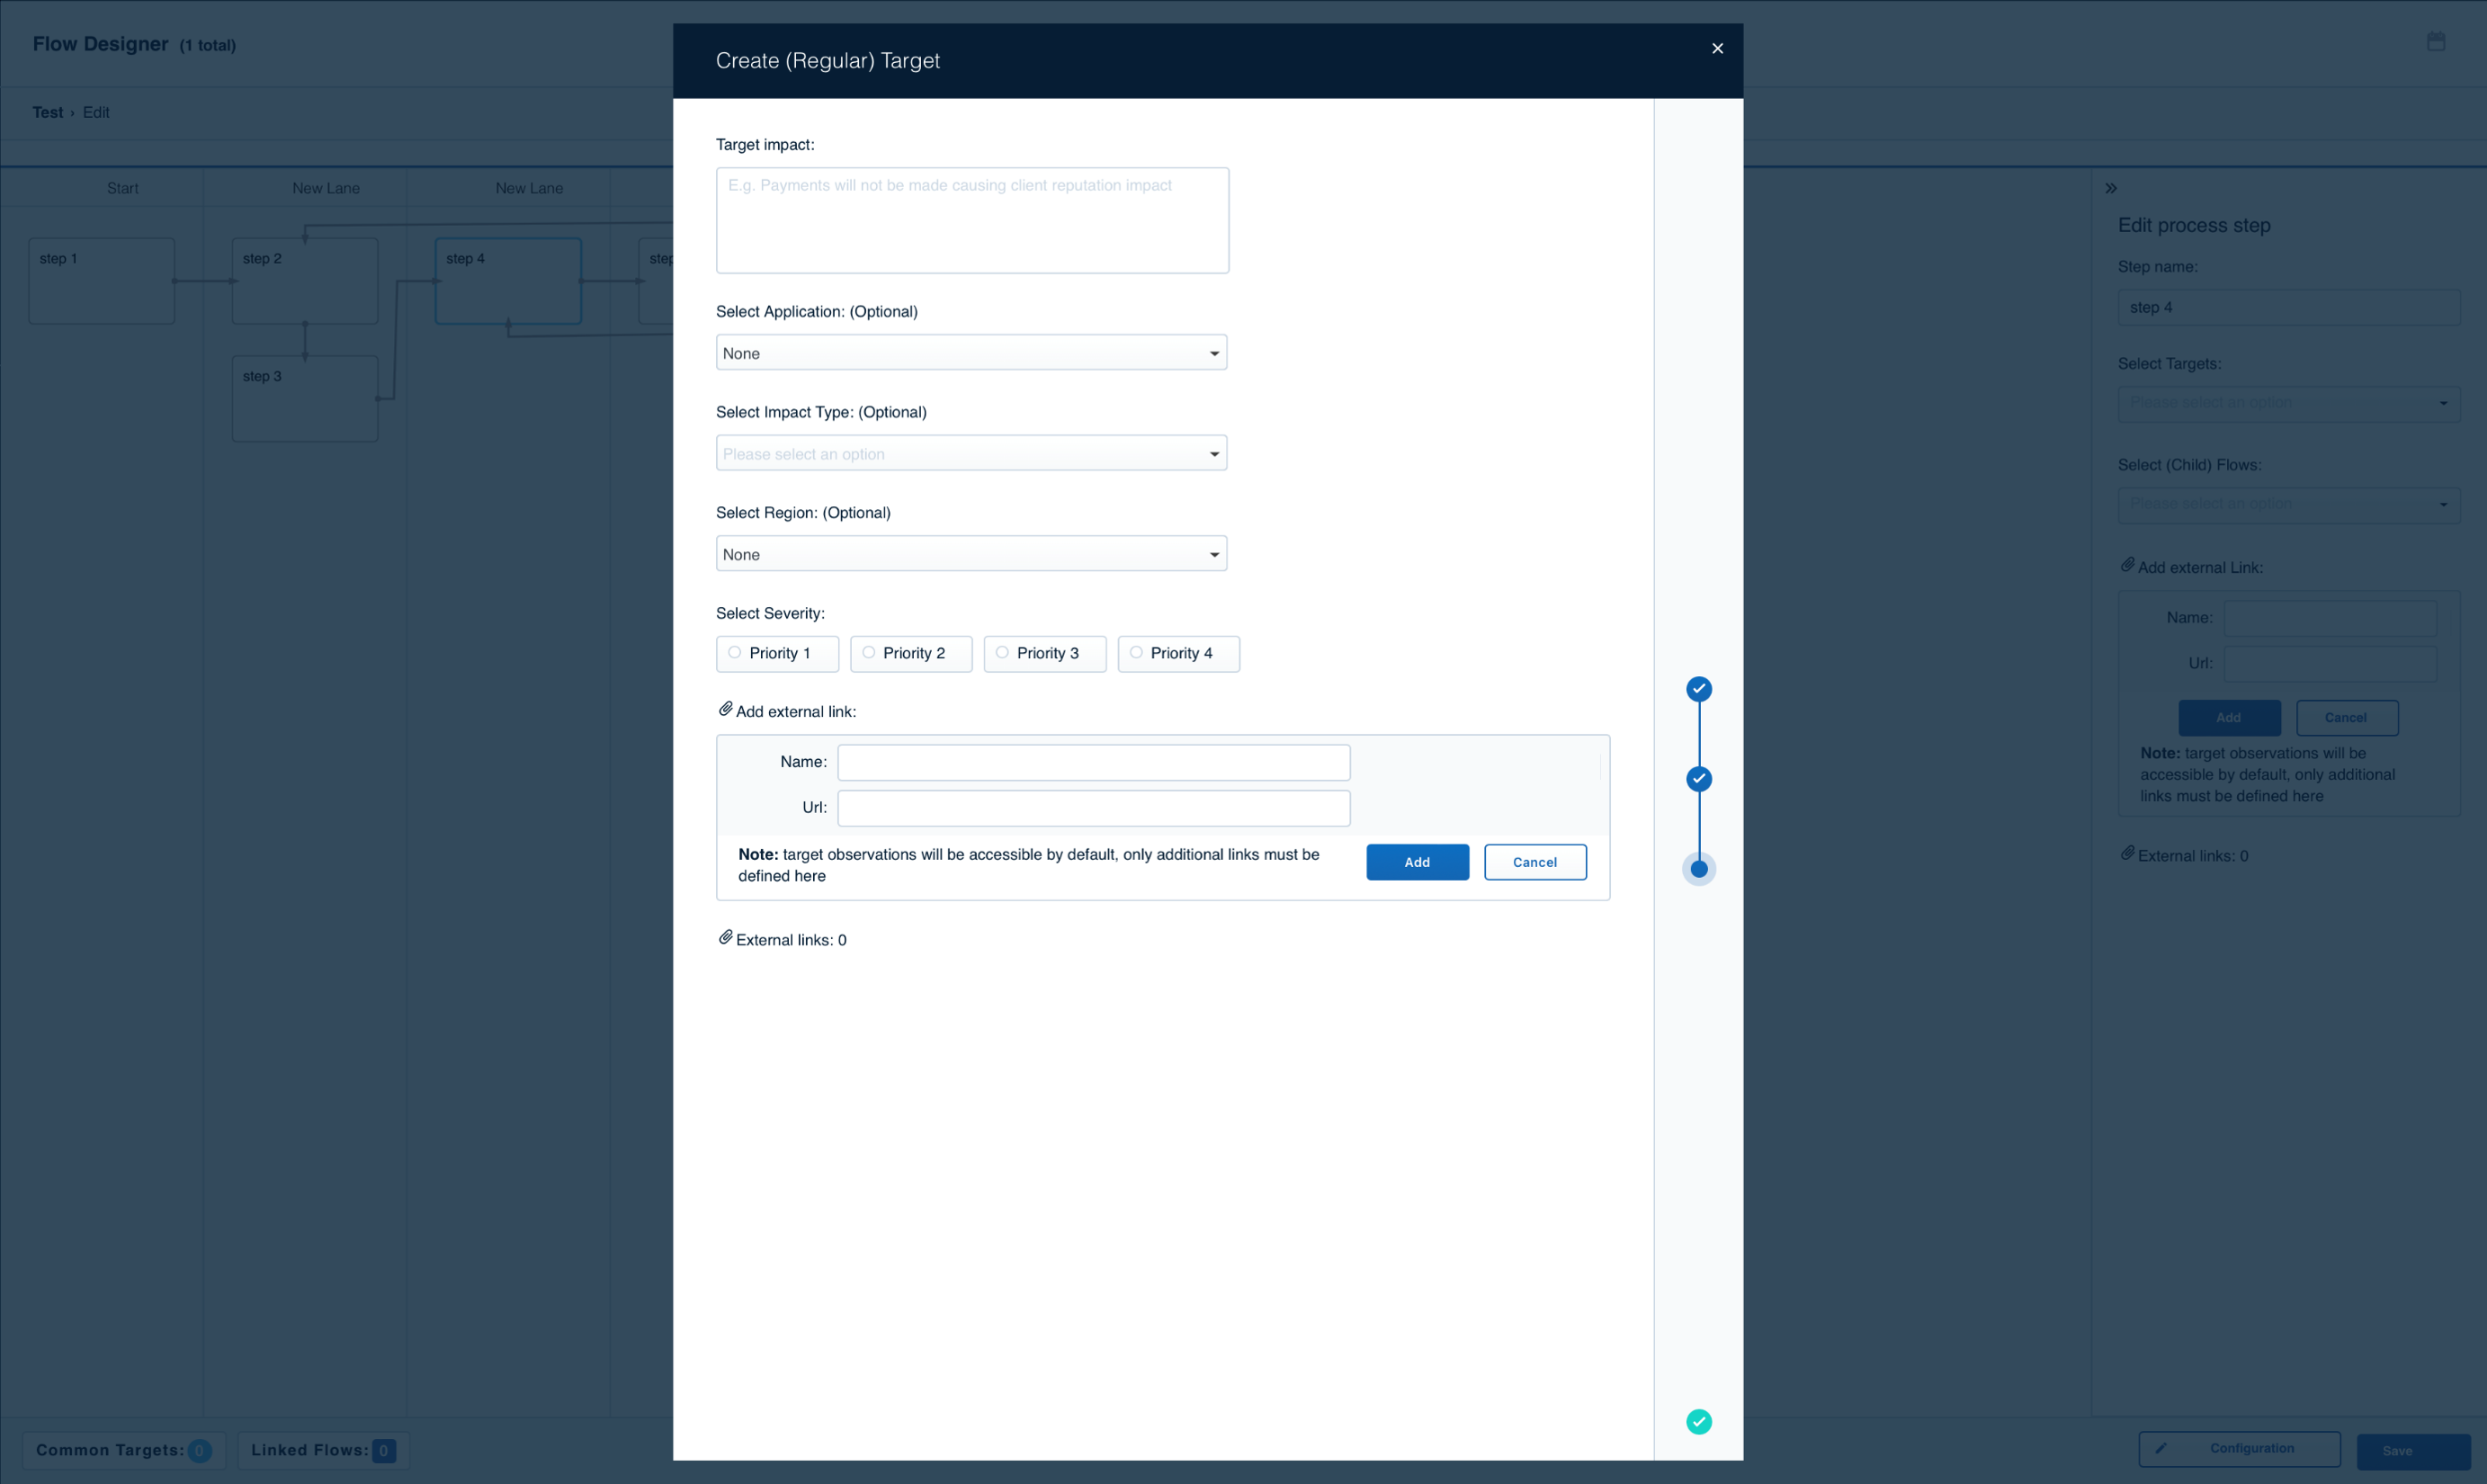
Fill the target impact, the severity of target breach, and other optional fields as per the requirements.
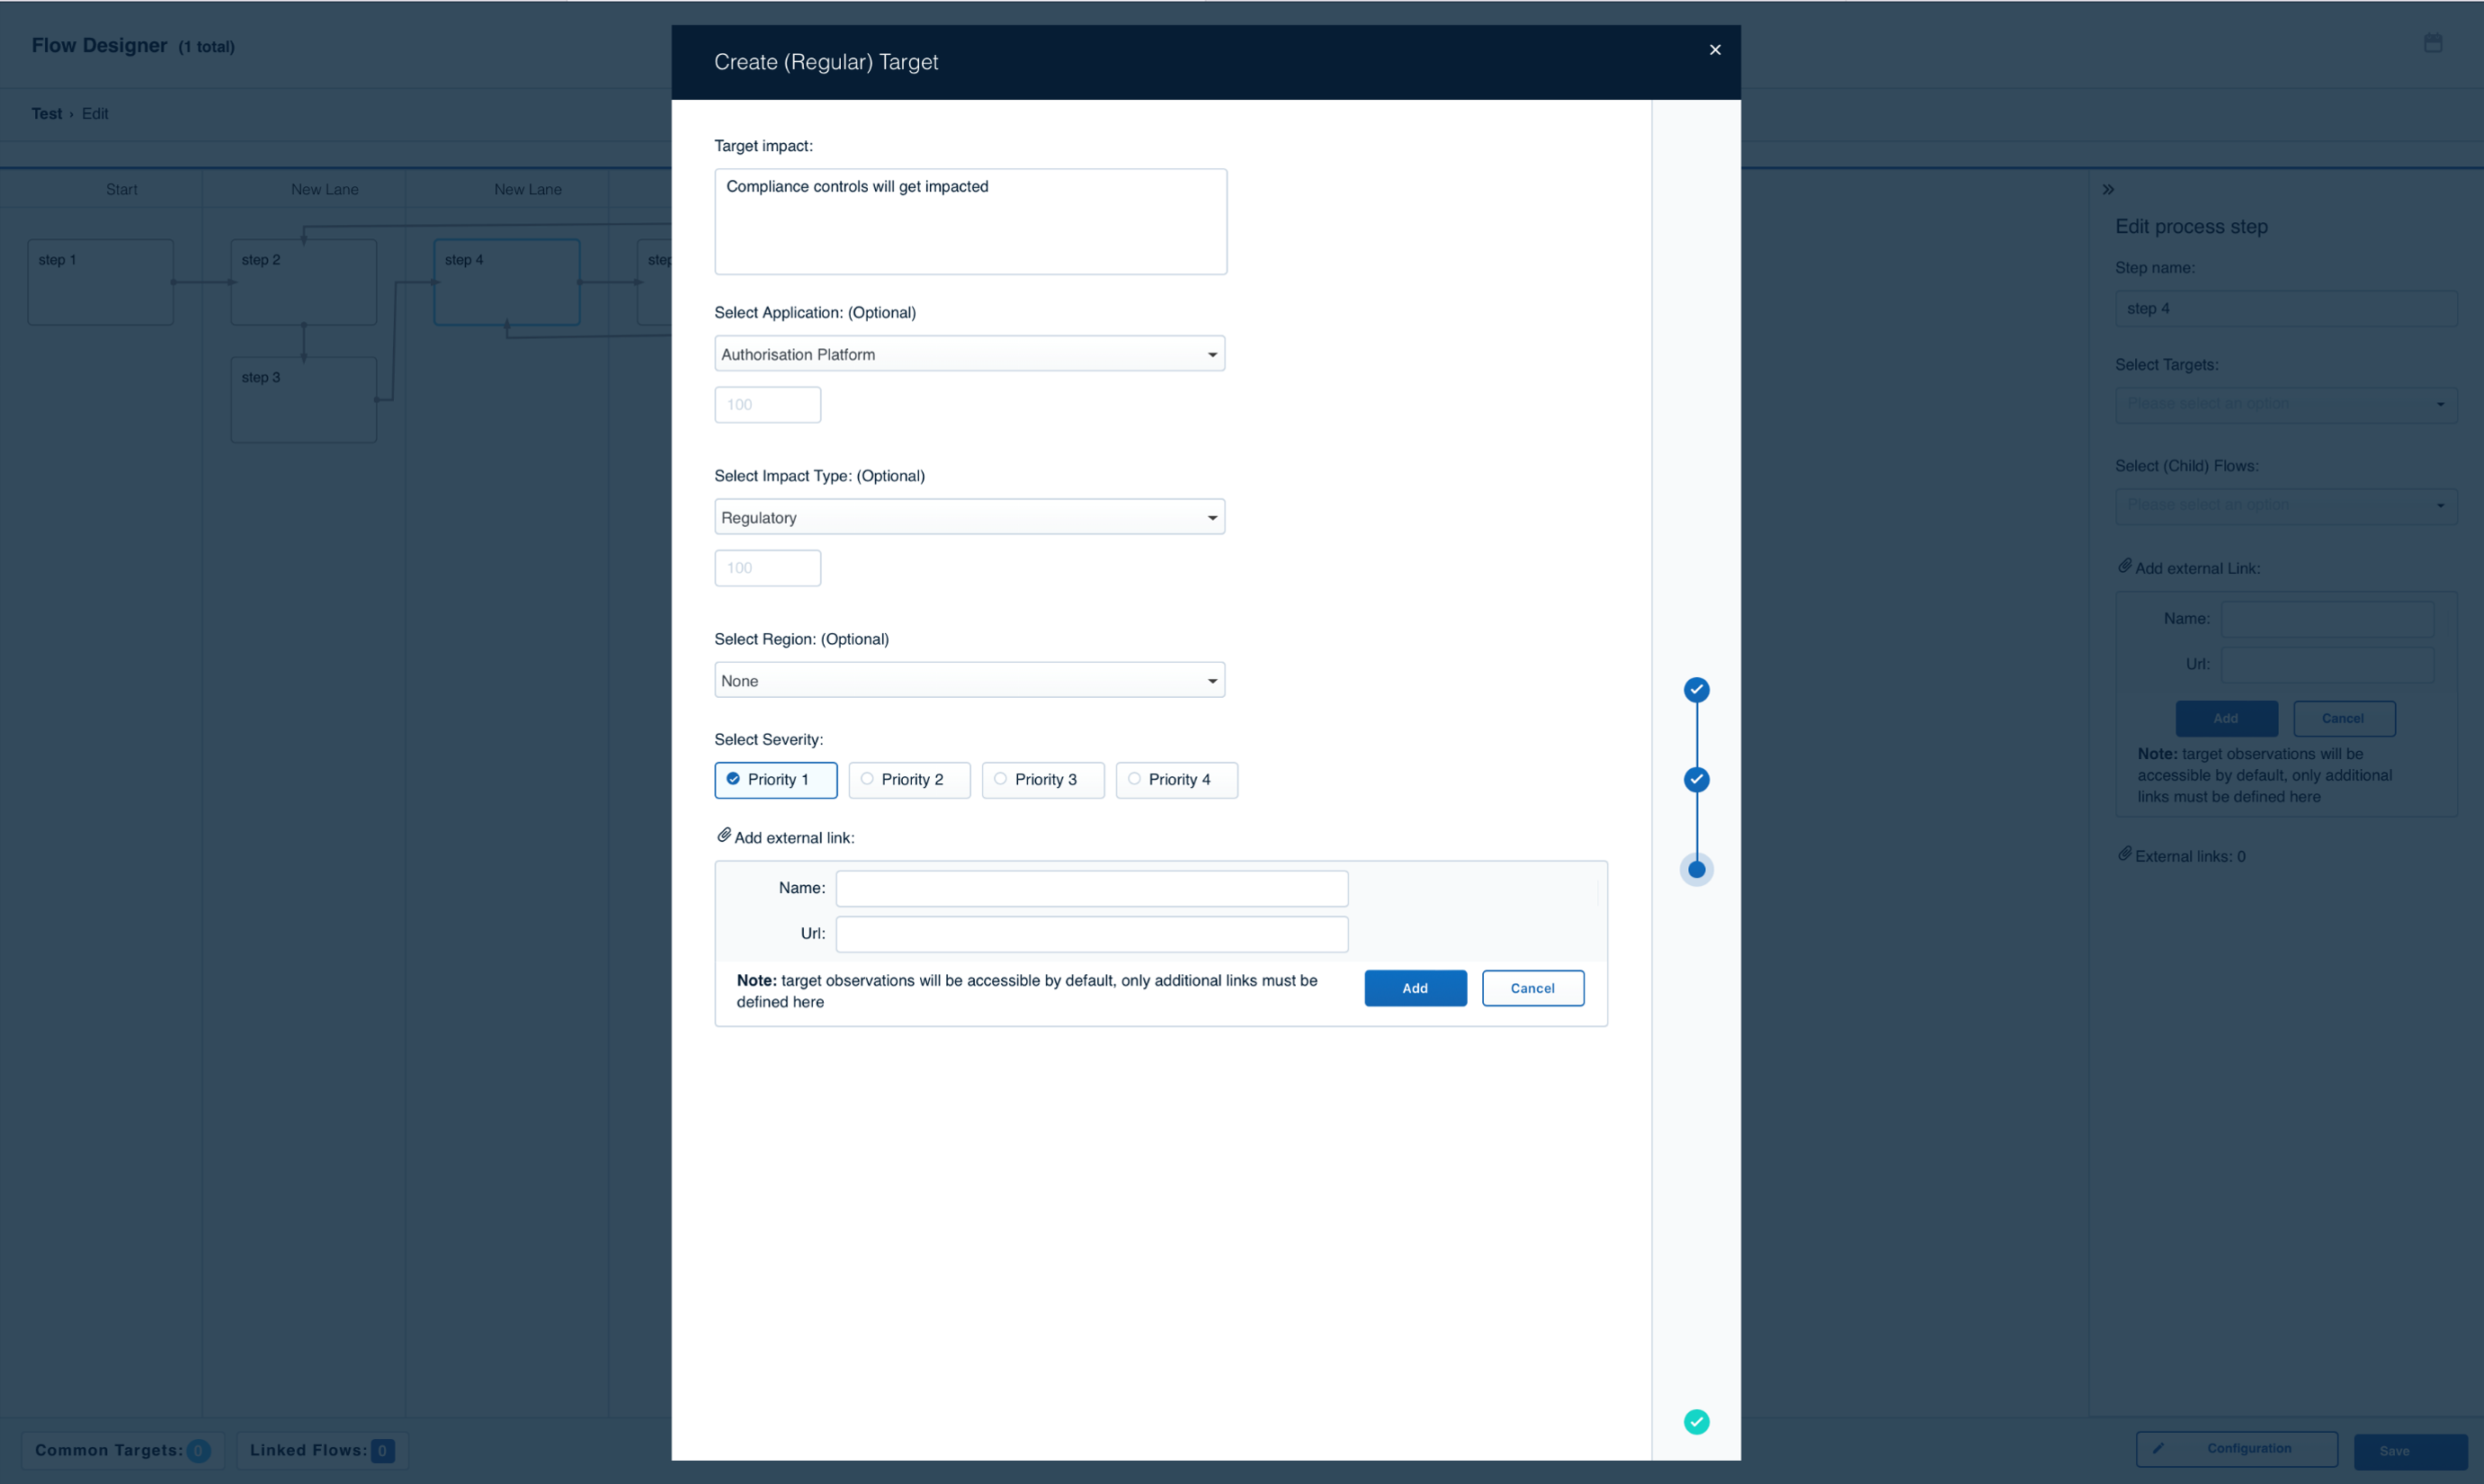
.png)
Click Next
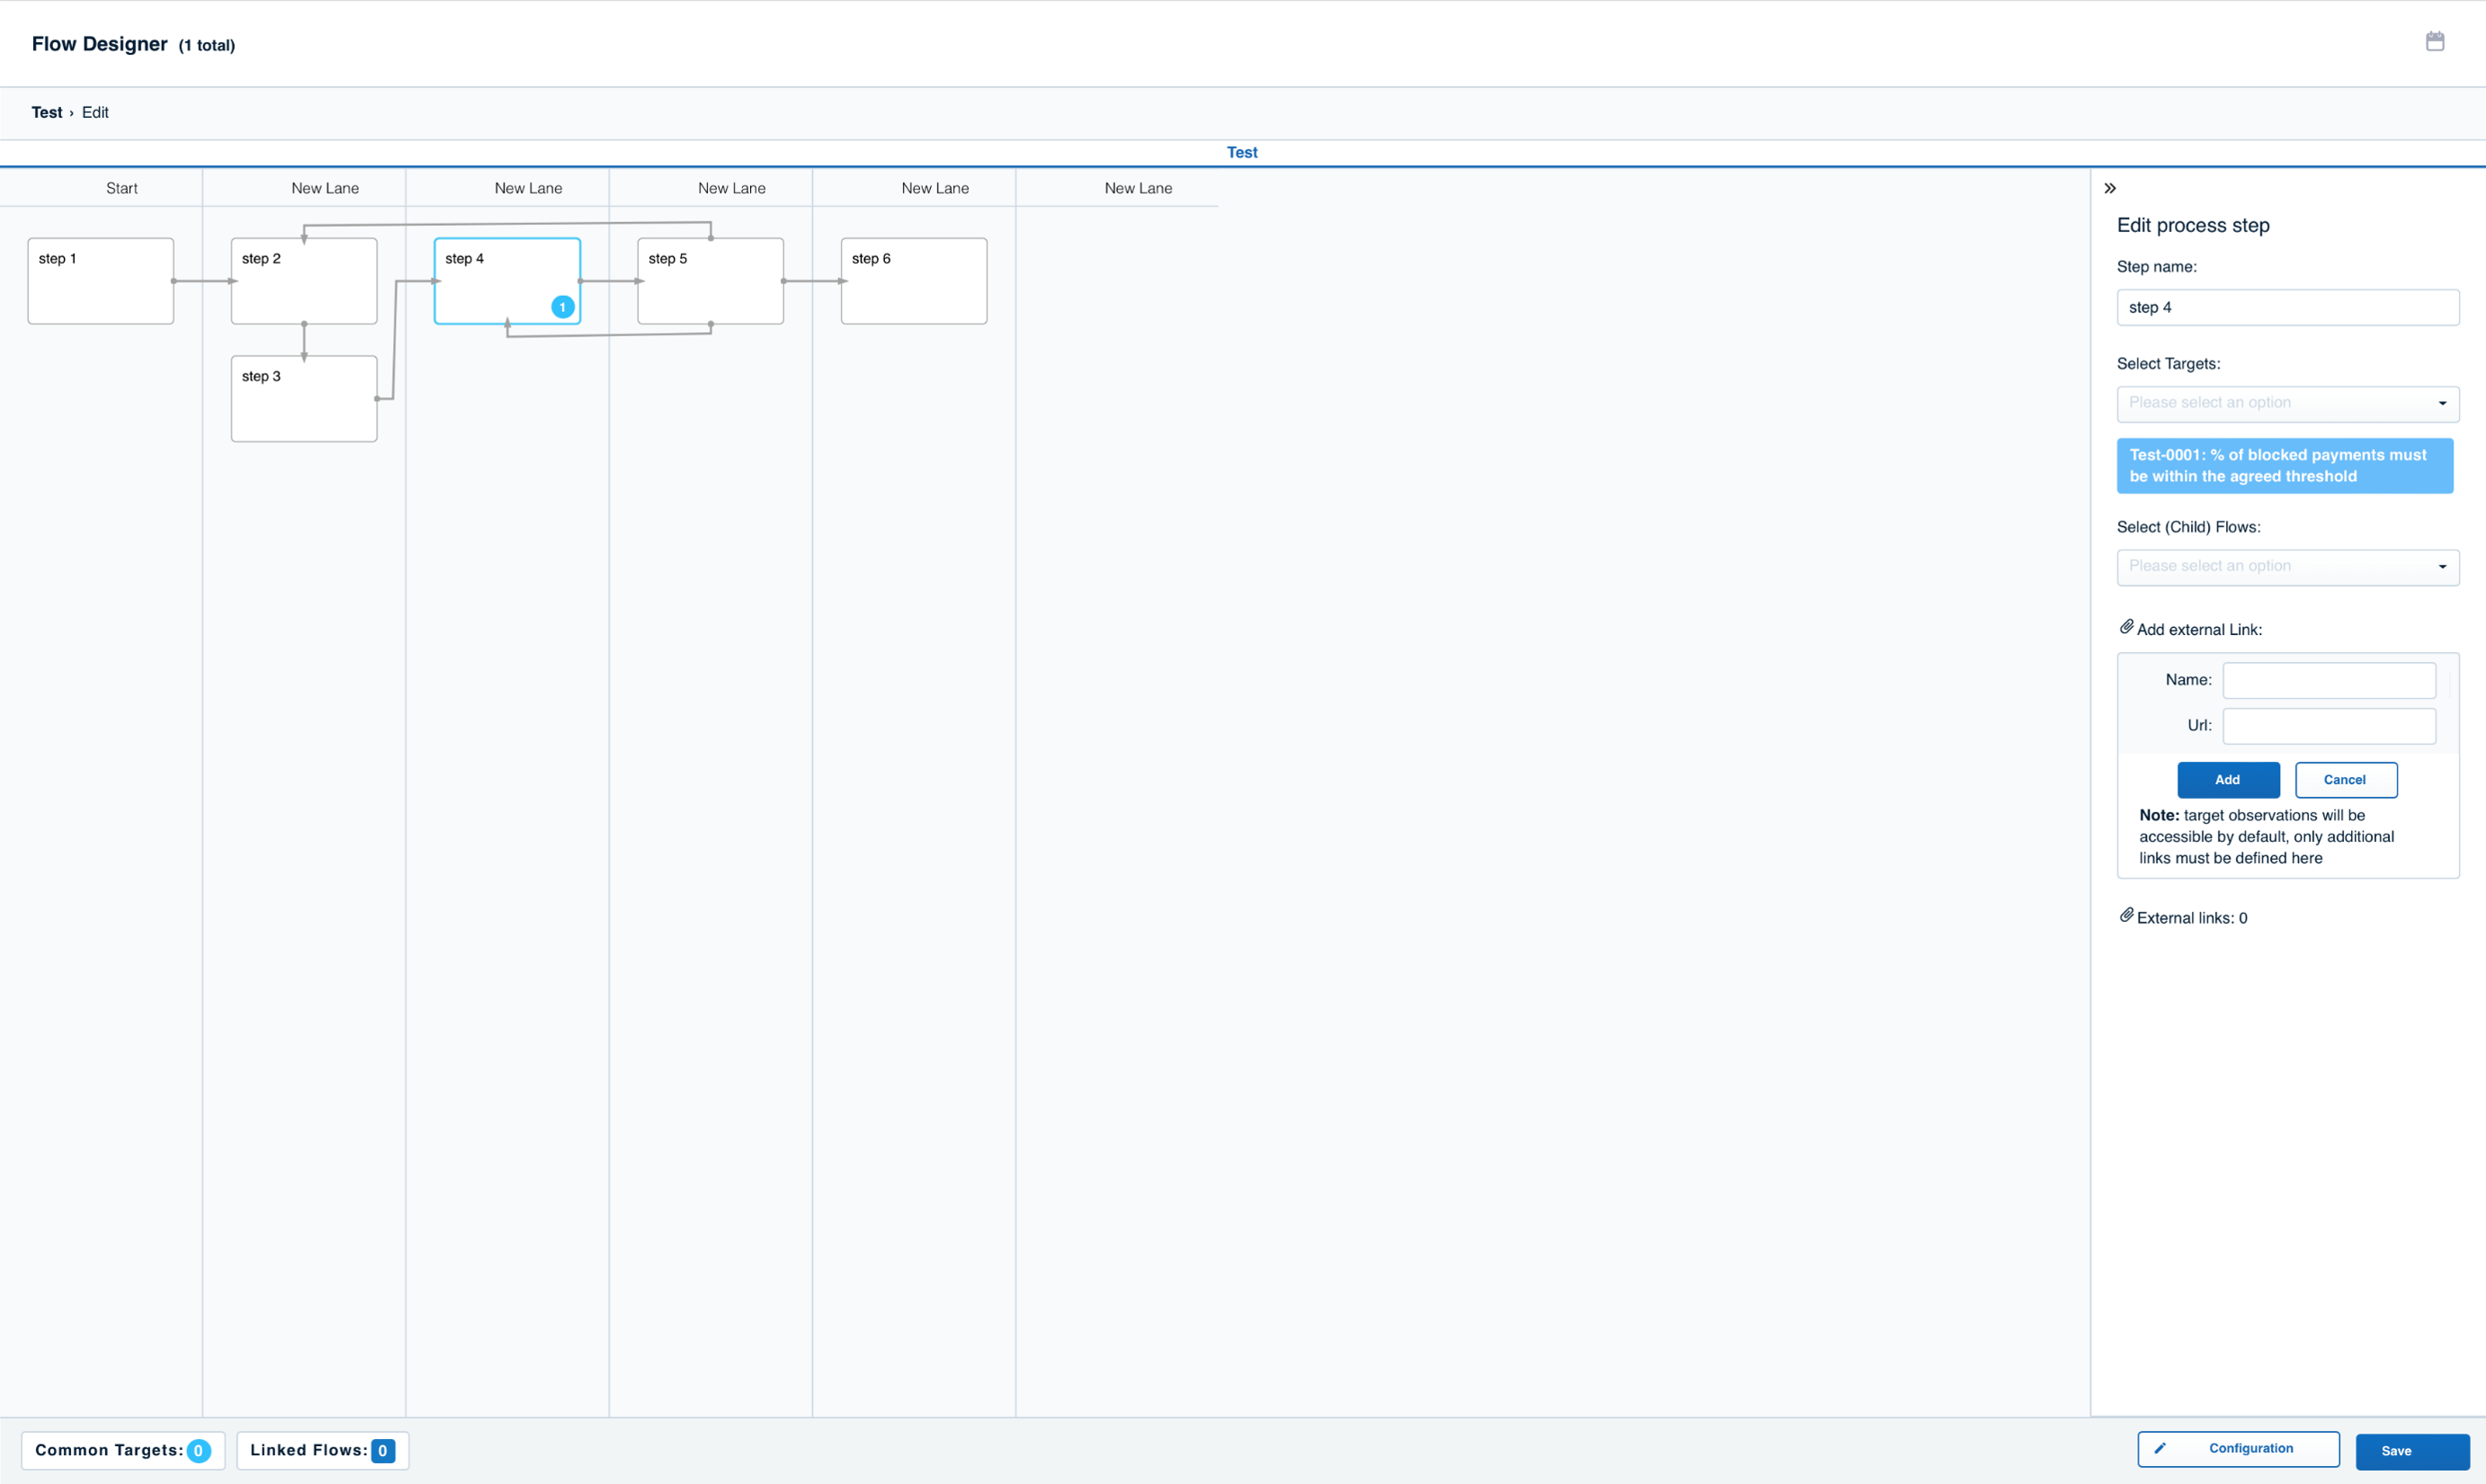

Once the flow is designed, click here to save your business flow and go back to the home screen.

.png)
.png)
.png)
Status of flow performance.
Real-time status of flow performance.
Drilldown and deep-dive options.

.png)
.png)
Status of flow performance.
Real-time status of flow performance.
Drilldown and deep-dive options.


Regular Performance: Enables the users to view the regular performance of all the contributing metrics of the selected dimension.


Weighted Performance: Enables the users to view the aggregated health of all the contributing metrics of the selected dimension.


iControl comes with a number of useful widgets. Scroll down to check out the first widget.
Next
Widget 1 -
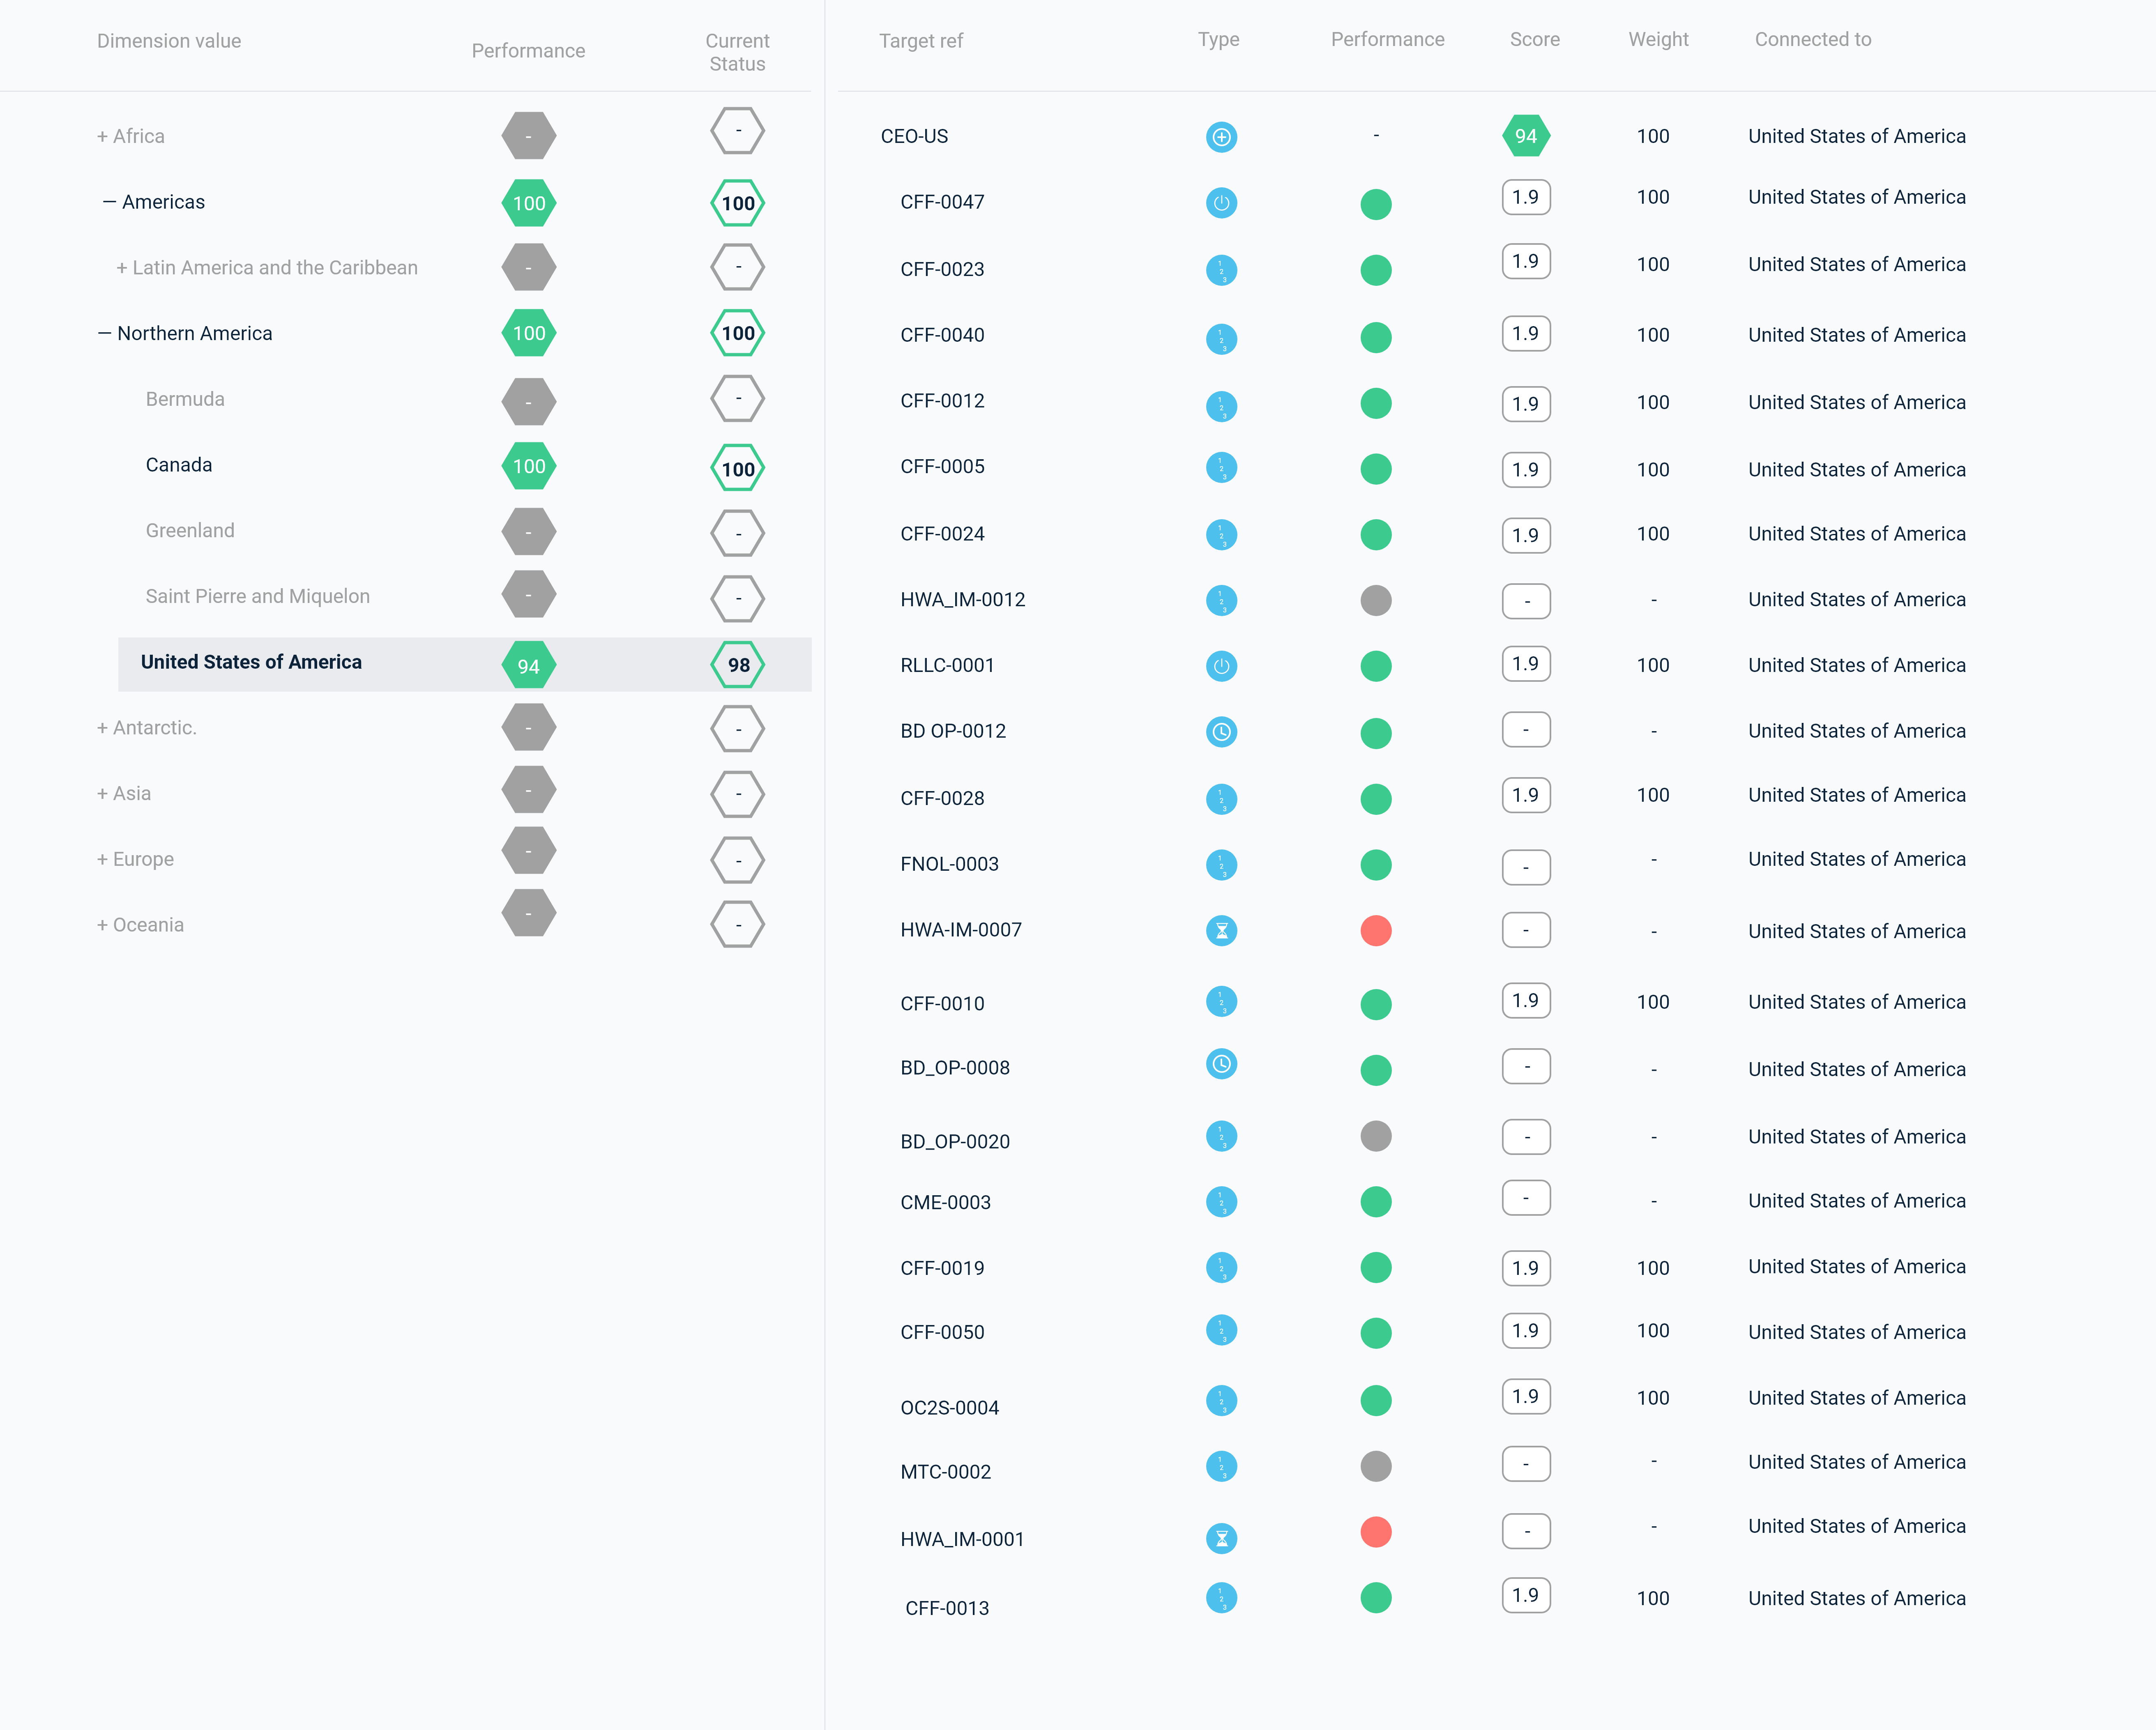
Aggregated View to track performance across geographies.

Aggregated View to track performance at the organizational level.
Next
Widget 2 -
Target Performance View


Widget 3 -
Group Target Performance View

Widget 4 -
Calendar Widget shows historical performance.

Customized dashboards as per the user requirements